FALSE00016444062021FYP7YP8YP1YP1Yhttp://fasb.org/us-gaap/2021-01-31#LongTermDebtAndCapitalLeaseObligationsCurrenthttp://fasb.org/us-gaap/2021-01-31#LongTermDebtAndCapitalLeaseObligationsCurrenthttp://fasb.org/us-gaap/2021-01-31#LongTermDebtAndCapitalLeaseObligationshttp://fasb.org/us-gaap/2021-01-31#LongTermDebtAndCapitalLeaseObligations0.56.500016444062021-01-012021-12-3100016444062021-06-30iso4217:USD0001644406us-gaap:CommonClassAMember2022-02-21xbrli:shares0001644406us-gaap:CommonClassBMember2022-02-2100016444062021-12-3100016444062020-12-310001644406us-gaap:CommonClassAMember2021-12-31iso4217:USDxbrli:shares0001644406us-gaap:CommonClassAMember2020-12-3100016444062020-01-012020-12-3100016444062019-01-012019-12-310001644406us-gaap:CommonStockMemberus-gaap:CommonClassAMember2018-12-310001644406us-gaap:CommonClassBMemberus-gaap:CommonStockMember2018-12-310001644406us-gaap:AdditionalPaidInCapitalMember2018-12-310001644406us-gaap:AccumulatedOtherComprehensiveIncomeMember2018-12-310001644406us-gaap:RetainedEarningsMember2018-12-310001644406us-gaap:TreasuryStockMember2018-12-310001644406us-gaap:ParentMember2018-12-310001644406us-gaap:NoncontrollingInterestMember2018-12-310001644406us-gaap:AccumulatedOtherComprehensiveIncomeMember2019-01-012019-12-310001644406us-gaap:RetainedEarningsMember2019-01-012019-12-310001644406us-gaap:ParentMember2019-01-012019-12-310001644406us-gaap:NoncontrollingInterestMember2019-01-012019-12-310001644406us-gaap:CommonStockMemberus-gaap:CommonClassAMember2019-01-012019-12-310001644406us-gaap:AdditionalPaidInCapitalMember2019-01-012019-12-310001644406us-gaap:CommonClassBMemberus-gaap:CommonStockMember2019-01-012019-12-310001644406us-gaap:CommonStockMemberus-gaap:CommonClassAMember2019-12-310001644406us-gaap:CommonClassBMemberus-gaap:CommonStockMember2019-12-310001644406us-gaap:AdditionalPaidInCapitalMember2019-12-310001644406us-gaap:AccumulatedOtherComprehensiveIncomeMember2019-12-310001644406us-gaap:RetainedEarningsMember2019-12-310001644406us-gaap:TreasuryStockMember2019-12-310001644406us-gaap:ParentMember2019-12-310001644406us-gaap:NoncontrollingInterestMember2019-12-310001644406us-gaap:AccumulatedOtherComprehensiveIncomeMember2020-01-012020-12-310001644406us-gaap:RetainedEarningsMember2020-01-012020-12-310001644406us-gaap:ParentMember2020-01-012020-12-310001644406us-gaap:NoncontrollingInterestMember2020-01-012020-12-310001644406us-gaap:CommonStockMemberus-gaap:CommonClassAMember2020-01-012020-12-310001644406us-gaap:AdditionalPaidInCapitalMember2020-01-012020-12-310001644406us-gaap:CommonClassBMemberus-gaap:CommonStockMember2020-01-012020-12-310001644406us-gaap:TreasuryStockMember2020-01-012020-12-310001644406us-gaap:CommonStockMemberus-gaap:CommonClassAMember2020-12-310001644406us-gaap:CommonClassBMemberus-gaap:CommonStockMember2020-12-310001644406us-gaap:AdditionalPaidInCapitalMember2020-12-310001644406us-gaap:AccumulatedOtherComprehensiveIncomeMember2020-12-310001644406us-gaap:RetainedEarningsMember2020-12-310001644406us-gaap:TreasuryStockMember2020-12-310001644406us-gaap:ParentMember2020-12-310001644406us-gaap:NoncontrollingInterestMember2020-12-310001644406us-gaap:AccumulatedOtherComprehensiveIncomeMember2021-01-012021-12-310001644406us-gaap:RetainedEarningsMember2021-01-012021-12-310001644406us-gaap:ParentMember2021-01-012021-12-310001644406us-gaap:CommonStockMemberus-gaap:CommonClassAMember2021-01-012021-12-310001644406us-gaap:AdditionalPaidInCapitalMember2021-01-012021-12-310001644406us-gaap:TreasuryStockMember2021-01-012021-12-310001644406us-gaap:CommonStockMemberus-gaap:CommonClassAMember2021-12-310001644406us-gaap:CommonClassBMemberus-gaap:CommonStockMember2021-12-310001644406us-gaap:AdditionalPaidInCapitalMember2021-12-310001644406us-gaap:AccumulatedOtherComprehensiveIncomeMember2021-12-310001644406us-gaap:RetainedEarningsMember2021-12-310001644406us-gaap:TreasuryStockMember2021-12-310001644406us-gaap:ParentMember2021-12-310001644406us-gaap:NoncontrollingInterestMember2021-12-3100016444062019-12-3100016444062018-12-310001644406srt:ParentCompanyMember2021-12-310001644406srt:ParentCompanyMember2020-12-31twnk:segment0001644406srt:MinimumMemberus-gaap:LandAndBuildingMember2021-01-012021-12-310001644406srt:MaximumMemberus-gaap:LandAndBuildingMember2021-01-012021-12-310001644406srt:MinimumMemberus-gaap:MachineryAndEquipmentMember2021-01-012021-12-310001644406srt:MaximumMemberus-gaap:MachineryAndEquipmentMember2021-01-012021-12-310001644406twnk:SnackingMember2020-01-012020-12-310001644406twnk:SnackingMember2019-01-012019-12-310001644406twnk:SnackingMember2021-01-012021-12-310001644406us-gaap:TrademarksAndTradeNamesMember2021-12-310001644406us-gaap:TrademarksAndTradeNamesMember2020-12-310001644406twnk:InStoreBakeryMember2019-01-012019-12-310001644406us-gaap:CustomerRelationshipsMember2021-12-310001644406us-gaap:CustomerRelationshipsMember2020-12-310001644406srt:MinimumMemberus-gaap:CustomerRelationshipsMember2021-01-012021-12-310001644406srt:MaximumMemberus-gaap:CustomerRelationshipsMember2021-01-012021-12-310001644406us-gaap:CustomerRelationshipsMember2021-01-012021-12-31xbrli:pure0001644406country:UStwnk:SweetBakedGoodsMember2021-01-012021-12-310001644406country:UStwnk:CookiesMember2021-01-012021-12-310001644406country:US2021-01-012021-12-310001644406country:CAtwnk:SweetBakedGoodsMember2021-01-012021-12-310001644406country:CAtwnk:CookiesMember2021-01-012021-12-310001644406country:CA2021-01-012021-12-310001644406twnk:SweetBakedGoodsMember2021-01-012021-12-310001644406twnk:CookiesMember2021-01-012021-12-310001644406country:UStwnk:SweetBakedGoodsMember2020-01-012020-12-310001644406country:UStwnk:CookiesMember2020-01-012020-12-310001644406country:US2020-01-012020-12-310001644406country:CAtwnk:SweetBakedGoodsMember2020-01-012020-12-310001644406country:CAtwnk:CookiesMember2020-01-012020-12-310001644406country:CA2020-01-012020-12-310001644406twnk:SweetBakedGoodsMember2020-01-012020-12-310001644406twnk:CookiesMember2020-01-012020-12-310001644406country:UStwnk:SweetBakedGoodsMember2019-01-012019-12-310001644406twnk:InStoreBakeryMembercountry:US2019-01-012019-12-310001644406country:US2019-01-012019-12-310001644406country:CAtwnk:SweetBakedGoodsMember2019-01-012019-12-310001644406twnk:InStoreBakeryMembercountry:CA2019-01-012019-12-310001644406country:CA2019-01-012019-12-310001644406twnk:SweetBakedGoodsMember2019-01-012019-12-310001644406us-gaap:SalesRevenueNetMembertwnk:SnackingMemberus-gaap:CustomerConcentrationRiskMembertwnk:OneCustomerMember2021-01-012021-12-310001644406us-gaap:SalesRevenueNetMembertwnk:SnackingMemberus-gaap:CustomerConcentrationRiskMembertwnk:OneCustomerMember2020-01-012020-12-310001644406us-gaap:SalesRevenueNetMembertwnk:SnackingMemberus-gaap:CustomerConcentrationRiskMembertwnk:OneCustomerMember2019-01-012019-12-310001644406us-gaap:SalesRevenueNetMemberus-gaap:CustomerConcentrationRiskMembertwnk:InStoreBakeryMembertwnk:OneCustomerMember2021-01-012021-12-310001644406us-gaap:SalesRevenueNetMemberus-gaap:CustomerConcentrationRiskMembertwnk:InStoreBakeryMembertwnk:OneCustomerMember2020-01-012020-12-310001644406us-gaap:SalesRevenueNetMemberus-gaap:CustomerConcentrationRiskMembertwnk:InStoreBakeryMembertwnk:OneCustomerMember2019-01-012019-12-310001644406us-gaap:SalesRevenueNetMemberus-gaap:CustomerConcentrationRiskMembertwnk:OneCustomerMember2021-01-012021-12-310001644406us-gaap:SalesRevenueNetMemberus-gaap:CustomerConcentrationRiskMembertwnk:OneCustomerMember2020-01-012020-12-310001644406us-gaap:SalesRevenueNetMemberus-gaap:CustomerConcentrationRiskMembertwnk:OneCustomerMember2019-01-012019-12-31twnk:agreement0001644406twnk:VoortmanMember2020-01-032020-01-03iso4217:CAD0001644406twnk:VoortmanMember2020-01-012020-12-310001644406twnk:VoortmanMember2020-12-310001644406twnk:VoortmanMember2021-01-012021-12-310001644406twnk:VoortmanMemberus-gaap:CustomerRelationshipsMember2020-12-310001644406twnk:VoortmanMemberus-gaap:TrademarksAndTradeNamesMember2020-12-310001644406twnk:VoortmanMembersrt:MinimumMemberus-gaap:CustomerRelationshipsMember2020-01-012020-12-310001644406srt:MaximumMembertwnk:VoortmanMemberus-gaap:CustomerRelationshipsMember2020-01-012020-12-310001644406twnk:VoortmanMember2019-01-012019-12-310001644406twnk:InStoreBakeryMember2019-08-302019-08-300001644406twnk:InStoreBakeryMember2019-01-012019-12-310001644406us-gaap:OtherOperatingIncomeExpenseMembertwnk:InStoreBakeryMember2019-01-012019-12-310001644406us-gaap:EmployeeSeveranceMember2020-01-012020-12-310001644406us-gaap:ContractTerminationMember2020-01-012020-12-310001644406us-gaap:EmployeeSeveranceMember2020-12-310001644406us-gaap:ContractTerminationMember2020-12-310001644406us-gaap:EmployeeSeveranceMember2021-01-012021-12-310001644406us-gaap:ContractTerminationMember2021-01-012021-12-310001644406us-gaap:EmployeeSeveranceMember2021-12-310001644406us-gaap:ContractTerminationMember2021-12-310001644406us-gaap:RestrictedStockUnitsRSUMembersrt:MinimumMember2021-01-012021-12-310001644406us-gaap:RestrictedStockUnitsRSUMembersrt:MaximumMember2021-01-012021-12-310001644406twnk:TotalSharebasedReturnAwardsMember2021-01-012021-12-310001644406us-gaap:RestrictedStockUnitsRSUMember2021-12-310001644406us-gaap:RestrictedStockUnitsRSUMember2020-12-310001644406us-gaap:RestrictedStockUnitsRSUMember2019-12-310001644406us-gaap:RestrictedStockUnitsRSUMember2020-01-012020-12-310001644406us-gaap:RestrictedStockUnitsRSUMember2021-01-012021-12-310001644406us-gaap:RestrictedStockUnitsRSUMemberus-gaap:AdditionalPaidInCapitalMember2020-01-012020-12-310001644406us-gaap:RestrictedStockUnitsRSUMemberus-gaap:AdditionalPaidInCapitalMember2021-01-012021-12-310001644406us-gaap:RestrictedStockUnitsRSUMemberus-gaap:GeneralAndAdministrativeExpenseMember2021-01-012021-12-310001644406us-gaap:RestrictedStockUnitsRSUMemberus-gaap:GeneralAndAdministrativeExpenseMember2020-01-012020-12-310001644406us-gaap:RestrictedStockUnitsRSUMemberus-gaap:GeneralAndAdministrativeExpenseMember2019-01-012019-12-310001644406us-gaap:EmployeeStockOptionMember2020-01-012020-12-310001644406us-gaap:GeneralAndAdministrativeExpenseMemberus-gaap:EmployeeStockOptionMember2021-01-012021-12-310001644406us-gaap:GeneralAndAdministrativeExpenseMemberus-gaap:EmployeeStockOptionMember2020-01-012020-12-310001644406us-gaap:GeneralAndAdministrativeExpenseMemberus-gaap:EmployeeStockOptionMember2019-01-012019-12-310001644406us-gaap:LandAndBuildingMember2021-12-310001644406us-gaap:LandAndBuildingMember2020-12-310001644406twnk:OperatingLeaseRightOfUseAssetsMember2021-12-310001644406twnk:OperatingLeaseRightOfUseAssetsMember2020-12-310001644406us-gaap:MachineryAndEquipmentMember2021-12-310001644406us-gaap:MachineryAndEquipmentMember2020-12-310001644406us-gaap:ConstructionInProgressMember2021-12-310001644406us-gaap:ConstructionInProgressMember2020-12-310001644406twnk:InStoreBakeryMember2021-01-012021-12-310001644406twnk:InStoreBakeryMember2020-01-012020-12-310001644406twnk:SnackingMember2019-12-310001644406twnk:SnackingMember2020-12-310001644406twnk:SnackingMember2021-12-310001644406twnk:HostessHoldingsMember2021-01-012021-12-310001644406us-gaap:SecuredDebtMember2020-01-030001644406us-gaap:SecuredDebtMember2020-01-032020-01-030001644406us-gaap:SecuredDebtMembertwnk:NewLIBORFloorMember2020-01-032020-01-030001644406us-gaap:SecuredDebtMembertwnk:LIBORFloorMember2020-01-032020-01-030001644406us-gaap:SecuredDebtMembertwnk:FourthNewFirstTermLoanMembertwnk:NewLIBORFloorMember2019-10-012019-10-010001644406us-gaap:SecuredDebtMembertwnk:FourthNewFirstTermLoanMembertwnk:LIBORFloorMember2019-10-012019-10-010001644406us-gaap:SecuredDebtMembertwnk:FourthNewFirstTermLoanMember2019-10-010001644406twnk:ThirdNewFirstTermLoanMemberus-gaap:SecuredDebtMember2017-11-200001644406twnk:ThirdNewFirstTermLoanMemberus-gaap:SecuredDebtMembertwnk:LIBORFloorMember2017-11-202017-11-200001644406us-gaap:SecuredDebtMembertwnk:NewFirstLienTermLoanMember2021-12-310001644406us-gaap:SecuredDebtMembertwnk:NewFirstLienTermLoanMember2020-12-310001644406us-gaap:SecuredDebtMember2021-12-310001644406us-gaap:SecuredDebtMember2020-12-310001644406us-gaap:SecuredDebtMembertwnk:FourthNewFirstTermLoanMember2021-12-310001644406twnk:HostessBrandsLLCMemberus-gaap:RevolvingCreditFacilityMember2019-10-010001644406us-gaap:RevolvingCreditFacilityMembersrt:MinimumMember2021-01-012021-12-310001644406us-gaap:RevolvingCreditFacilityMembersrt:MaximumMember2021-01-012021-12-310001644406us-gaap:RevolvingCreditFacilityMemberus-gaap:LondonInterbankOfferedRateLIBORMember2021-01-012021-12-310001644406us-gaap:BaseRateMemberus-gaap:RevolvingCreditFacilityMember2021-01-012021-12-310001644406us-gaap:RevolvingCreditFacilityMembersrt:MinimumMemberus-gaap:LondonInterbankOfferedRateLIBORMember2021-01-012021-12-310001644406us-gaap:RevolvingCreditFacilityMembersrt:MaximumMemberus-gaap:LondonInterbankOfferedRateLIBORMember2021-01-012021-12-310001644406us-gaap:BaseRateMemberus-gaap:RevolvingCreditFacilityMembersrt:MinimumMember2021-01-012021-12-310001644406us-gaap:BaseRateMemberus-gaap:RevolvingCreditFacilityMembersrt:MaximumMember2021-01-012021-12-310001644406us-gaap:RevolvingCreditFacilityMember2020-12-310001644406us-gaap:RevolvingCreditFacilityMember2021-12-310001644406twnk:PublicWarrantsMember2021-12-310001644406twnk:PublicWarrantsMember2020-12-310001644406twnk:PrivatePlacementWarrantMember2020-12-3100016444062021-07-310001644406twnk:PublicWarrantsMember2020-11-300001644406us-gaap:InterestRateSwapMemberus-gaap:CashFlowHedgingMemberus-gaap:DesignatedAsHedgingInstrumentMember2019-12-310001644406us-gaap:SecuredDebtMembertwnk:LIBORFloorMember2019-01-012019-12-310001644406us-gaap:InterestRateSwapMemberus-gaap:LondonInterbankOfferedRateLIBORMemberus-gaap:CashFlowHedgingMemberus-gaap:DesignatedAsHedgingInstrumentMember2019-12-310001644406us-gaap:InterestRateSwapMemberus-gaap:CashFlowHedgingMemberus-gaap:DesignatedAsHedgingInstrumentMember2019-01-012019-12-310001644406us-gaap:InterestRateSwapMemberus-gaap:CashFlowHedgingMemberus-gaap:DesignatedAsHedgingInstrumentMember2021-12-310001644406us-gaap:SecuredDebtMemberus-gaap:InterestRateSwapMemberus-gaap:CashFlowHedgingMemberus-gaap:DesignatedAsHedgingInstrumentMember2020-01-012020-12-310001644406us-gaap:SecuredDebtMemberus-gaap:InterestRateSwapMemberus-gaap:CashFlowHedgingMemberus-gaap:DesignatedAsHedgingInstrumentMember2020-12-310001644406us-gaap:SecuredDebtMemberus-gaap:InterestRateSwapMembersrt:MinimumMemberus-gaap:CashFlowHedgingMemberus-gaap:DesignatedAsHedgingInstrumentMember2020-12-310001644406us-gaap:SecuredDebtMembersrt:MaximumMemberus-gaap:InterestRateSwapMemberus-gaap:CashFlowHedgingMemberus-gaap:DesignatedAsHedgingInstrumentMember2020-12-310001644406us-gaap:SecuredDebtMembertwnk:LIBORFloorMember2020-01-012020-12-310001644406us-gaap:SecuredDebtMemberus-gaap:InterestRateSwapMemberus-gaap:LondonInterbankOfferedRateLIBORMemberus-gaap:CashFlowHedgingMemberus-gaap:DesignatedAsHedgingInstrumentMember2020-12-310001644406us-gaap:SecuredDebtMemberus-gaap:InterestRateSwapMembersrt:MinimumMemberus-gaap:CashFlowHedgingMemberus-gaap:DesignatedAsHedgingInstrumentMember2021-12-310001644406us-gaap:SecuredDebtMembersrt:MaximumMemberus-gaap:InterestRateSwapMemberus-gaap:CashFlowHedgingMemberus-gaap:DesignatedAsHedgingInstrumentMember2021-12-310001644406us-gaap:SecuredDebtMemberus-gaap:InterestRateSwapMemberus-gaap:CashFlowHedgingMemberus-gaap:DesignatedAsHedgingInstrumentMemberus-gaap:SubsequentEventMember2022-02-012022-02-280001644406us-gaap:SecuredDebtMemberus-gaap:InterestRateSwapMemberus-gaap:CashFlowHedgingMemberus-gaap:DesignatedAsHedgingInstrumentMemberus-gaap:SubsequentEventMember2022-02-280001644406us-gaap:SecuredDebtMembertwnk:LIBORFloorMemberus-gaap:SubsequentEventMember2022-02-012022-02-280001644406us-gaap:SecuredDebtMemberus-gaap:InterestRateSwapMemberus-gaap:LondonInterbankOfferedRateLIBORMemberus-gaap:CashFlowHedgingMemberus-gaap:DesignatedAsHedgingInstrumentMemberus-gaap:SubsequentEventMember2022-02-280001644406us-gaap:CashFlowHedgingMember2021-12-310001644406us-gaap:ForeignExchangeContractMemberus-gaap:DesignatedAsHedgingInstrumentMember2021-12-310001644406us-gaap:InterestRateSwapMemberus-gaap:OtherCurrentAssetsMember2021-12-310001644406us-gaap:InterestRateSwapMemberus-gaap:OtherCurrentAssetsMember2020-12-310001644406us-gaap:AccruedLiabilitiesMemberus-gaap:InterestRateSwapMember2021-12-310001644406us-gaap:AccruedLiabilitiesMemberus-gaap:InterestRateSwapMember2020-12-310001644406us-gaap:AccruedLiabilitiesMemberus-gaap:ForeignExchangeContractMember2021-12-310001644406us-gaap:AccruedLiabilitiesMemberus-gaap:ForeignExchangeContractMember2020-12-310001644406us-gaap:InterestExpenseMemberus-gaap:InterestRateSwapMember2021-01-012021-12-310001644406us-gaap:InterestExpenseMemberus-gaap:InterestRateSwapMember2020-01-012020-12-310001644406us-gaap:InterestExpenseMemberus-gaap:InterestRateSwapMember2019-01-012019-12-310001644406us-gaap:ForeignExchangeContractMemberus-gaap:CostOfSalesMember2021-01-012021-12-310001644406us-gaap:ForeignExchangeContractMemberus-gaap:CostOfSalesMember2020-01-012020-12-310001644406us-gaap:ForeignExchangeContractMemberus-gaap:CostOfSalesMember2019-01-012019-12-310001644406us-gaap:ForeignExchangeContractMemberus-gaap:GainLossOnDerivativeInstrumentsMember2021-01-012021-12-310001644406us-gaap:ForeignExchangeContractMemberus-gaap:GainLossOnDerivativeInstrumentsMember2020-01-012020-12-310001644406us-gaap:ForeignExchangeContractMemberus-gaap:GainLossOnDerivativeInstrumentsMember2019-01-012019-12-310001644406us-gaap:OtherExpenseMemberus-gaap:ForeignExchangeContractMember2021-01-012021-12-310001644406us-gaap:OtherExpenseMemberus-gaap:ForeignExchangeContractMember2020-01-012020-12-310001644406us-gaap:OtherExpenseMemberus-gaap:ForeignExchangeContractMember2019-01-012019-12-310001644406us-gaap:InterestRateSwapMember2021-12-310001644406us-gaap:ForeignExchangeContractMember2021-12-31twnk:class0001644406us-gaap:CommonClassBMember2021-12-310001644406twnk:CommonClassFMember2021-12-310001644406twnk:CommonClassFMember2020-12-310001644406us-gaap:CommonClassBMember2020-12-310001644406us-gaap:RestrictedStockUnitsRSUMember2019-01-012019-12-310001644406us-gaap:EmployeeStockOptionMember2021-01-012021-12-310001644406us-gaap:EmployeeStockOptionMember2019-01-012019-12-310001644406us-gaap:StateAndLocalJurisdictionMember2021-12-310001644406us-gaap:StateAndLocalJurisdictionMember2020-12-310001644406us-gaap:PrepaidExpensesAndOtherCurrentAssetsMember2021-12-310001644406us-gaap:PrepaidExpensesAndOtherCurrentAssetsMember2020-12-310001644406srt:MaximumMembertwnk:DevelopmentAuthorityofColumbusGAMember2021-12-31twnk:renewal_period0001644406twnk:IngredientsMember2021-12-310001644406twnk:PackagingMember2021-12-310001644406twnk:FacilityInArkadelphiaARMemberus-gaap:SubsequentEventMember2022-02-222022-02-220001644406twnk:StandbyLettersofCreditOneMember2021-12-310001644406twnk:StandbyLettersofCreditOneMember2020-12-31
UNITED STATES
SECURITIES AND EXCHANGE COMMISSION
Washington, D.C. 20549
FORM 10-K
| | | | | | | | |
| ☒ | ANNUAL REPORT PURSUANT TO SECTION 13 OR 15(d) OF THE SECURITIES EXCHANGE ACT OF 1934 |
| For the fiscal year ended | December 31, 2021 |
| | |
| ☐ | TRANSITION REPORT PURSUANT TO SECTION 13 OR 15(d) OF THE SECURITIES EXCHANGE ACT OF 1934 |
| For the transition period from to |
Commission file number 001-37540
HOSTESS BRANDS, INC.
(Exact name of registrant as specified in its charter) | | | | | | | | | | | | | | | | | | | | | | | | | | |
Delaware | | | 47-4168492 | |
(State or other jurisdiction of incorporation or organization) | | (I.R.S. Employer Identification No.) |
7905 Quivira Road,
| Lenexa, | KS | | | 66215 | |
| (Address of principal executive offices) | | | (zip code) | |
(816) 701-4600
Registrant’s telephone number, including area code
Securities registered pursuant to Section 12(b) of the Act | | | | | | | | |
| Title of Each Class | Ticker Symbol | Name of Each Exchange on Which Registered |
| Class A Common Stock, par value of $0.0001 per share | TWNK | The Nasdaq Stock Market LLC |
Securities registered pursuant to Section 12(g) of the Act: None.
Indicate by check mark if the Registrant is a well-known seasoned issuer, as defined in Rule 405 of the Securities Act. Yes x No ¨
Indicate by check mark if the Registrant is not required to file reports pursuant to Section 13 or Section 15(d) of the Act. Yes ¨ No x
Indicate by check mark whether the registrant (1) has filed all reports required to be filed by Section 13 or 15(d) of the Securities Exchange Act of 1934 during the preceding 12 months (or for such shorter period that the registrant was required to file such reports), and (2) has been subject to such filing requirements for the past 90 days.Yes x No o
Indicate by check mark whether the registrant has submitted electronically and every Interactive Data File required to be submitted pursuant to Rule 405 of Regulation S-T (§229.405 of this chapter) during the preceding 12 months (or for such shorter period that the registrant was required to submit such files). Yes x No o
Indicate by check mark whether the registrant is a large accelerated filer, an accelerated filer, a non-accelerated filer, a smaller reporting company, or an emerging growth company. See definitions of “large accelerated filer,” “accelerated filer,” “smaller reporting company,” and “emerging growth company” in Rule 12b-2 of the Exchange Act.: | | | | | | | | | | | | | | | | | | | | | | | | | | | | | |
| Large accelerated filer | ☒ | Accelerated filer | ☐ | Non-accelerated filer | ☐ | Smaller reporting company | ☐ | Emerging growth company | ☐ |
If an emerging growth company, indicate by check mark if the registrant has elected not to use the extended transition period for complying with any new or revised financial accounting standards provided pursuant to Section 13(a) of the Exchange Act.
Indicate by check mark whether the registrant has filed a report on and attestation to its management’s assessment of the effectiveness of its internal control over financial reporting under Section 404(b) of the Sarbanes-Oxley Act (15 U.S.C. 7262(b)) by the registered public accounting firm that prepared or issued its audit report. ☒
Indicate by check mark whether the registrant is a shell company (as defined in Rule 12b-2 of the Act). Yes ☐ No x
The aggregate market value of the voting and non-voting common equity held by non-affiliates of the registrant on June 30, 2021, computed by reference to the closing price reported on the Nasdaq Capital Market on such date was $2,109,473,508 (130,294,843 shares at a closing price per share of $16.19).
Shares of Class A common stock outstanding - 138,564,542 shares at February 21, 2022
Shares of Class B common stock outstanding - no shares at February 21, 2022
DOCUMENTS INCORPORATED BY REFERENCE
Portions of the Registrant’s definitive proxy statement relating to its 2022 annual meeting of stockholders (the “2022 Proxy Statement”) are incorporated by reference into Part III of this Annual Report on Form 10-K where indicated. The 2022 Proxy Statement will be filed with the U.S. Securities and Exchange Commission within 120 days after the end of the fiscal year to which this report relates.
HOSTESS BRANDS, INC.
FORM 10-K
FOR THE YEAR ENDED December 31, 2021
INDEX | | | | | | | | |
| | Page |
Part I |
Item 1. | Business | |
Item 1A. | Risk Factors | |
Item 1B. | Unresolved Staff Comments | |
Item 2. | Properties | |
Item 3. | Legal Proceedings | |
Item 4. | Mine Safety Disclosures | |
| Part II |
Item 5. | Market for Registrant’s Common Equity, Related Stockholder Matters and Issuer Purchases of Equity Securities | |
| Item 6. | Selected Financial Data | |
Item 7. | Management’s Discussion and Analysis of Financial Condition and Results of Operations | |
Item 7A. | Quantitative and Qualitative Disclosures about Market Risk | |
Item 8. | Financial Statements and Supplementary Data | |
Item 9. | Changes in and Disagreements with Accountants on Accounting and Financial Disclosure | |
Item 9A. | Controls and Procedures | |
Item 9B. | Other Information | |
| Item 9C | Disclosure Regarding Foreign Jurisdictions that Prevent Inspections | |
| Part III |
Item 10. | Directors, Executive Officers and Corporate Governance | |
Item 11. | Executive Compensation | |
Item 12. | Security Ownership of Certain Beneficial Owners and Management and Related Stockholder Matters | |
Item 13. | Certain Relationships and Related Transactions, and Director Independence | |
Item 14. | Principal Accounting Fees and Services | |
| Part IV |
| Item 15. | Exhibits, Financial Statement Schedules | |
Cautionary Note Regarding Forward Looking Statements
This Annual Report on Form 10-K (“Annual Report”) contains statements reflecting our views about our future performance that constitute “forward-looking statements” within the meaning of Section 27A of the Securities Act of 1933, as amended (the “Securities Act”) and Section 21E of the Securities Exchange Act of 1934, as amended (the “Exchange Act”), that involve substantial risks and uncertainties. All statements contained in this Annual Report other than statements of historical fact, including statements regarding our future results of operations and financial position, our business strategy and plans, and our objectives for future operations, are forward-looking statements. Statements that constitute forward-looking statements are generally identified through the inclusion of words such as “believes,” “expects,” “intends,” “estimates,” “projects,” “anticipates,” “will,” “plan,” “may,” “should,” or similar language. Statements addressing our future operating performance and statements addressing events and developments that we expect or anticipate will occur are also considered as forward-looking statements. All forward-looking statements included herein are made only as of the date hereof. It is routine for our internal projections and expectations to change throughout the year, and any forward-looking statements based upon these projections or expectations may change prior to the end of the next quarter or year. Readers of this Annual Report are cautioned not to place undue reliance on any such forward-looking statements. As a result of a number of known and unknown risks and uncertainties, our actual results or performance may be materially different from those expressed or implied by these forward-looking statements. Risks and uncertainties are identified and discussed in Item 1A-Risk Factors in this Annual Report. All subsequent written or oral forward-looking statements attributable to us or persons acting on our behalf are expressly qualified in their entirety by these risk factors. We undertake no obligation to update any forward-looking statement, whether as a result of new information, future events, or otherwise. The discussion and analysis of our financial condition and results of operations included in Item 7- Management’s Discussion and Analysis of Financial Condition and Results of Operations should be read in conjunction with our consolidated financial statements and related notes included in Item 8 of this Annual Report.
Explanatory Note
Hostess Brands, Inc. (f/k/a Gores Holdings, Inc.) was originally incorporated in Delaware on June 1, 2015 as a special purpose acquisition company and consummated its initial public offering, on August 19, 2015, following which its shares began trading on the Nasdaq Capital Market (“Nasdaq”).
On November 4, 2016, in a transaction referred to as the “Hostess Business Combination,” Gores Holdings, Inc. acquired a controlling interest in Hostess Holdings, L.P. (“Hostess Holdings”), an entity owned indirectly by C. Dean Metropoulos (the “Metropoulos Entities”) and certain equity funds managed by affiliates of Apollo Global Management, LLC.
In connection with the closing of the Hostess Business Combination, Gores Holdings, Inc. changed its name to Hostess Brands, Inc. and its trading symbols on Nasdaq from “GRSH” and “GRSHW,” to “TWNK” and “TWNKW”.
PART I
Item 1. Business
Who We Are
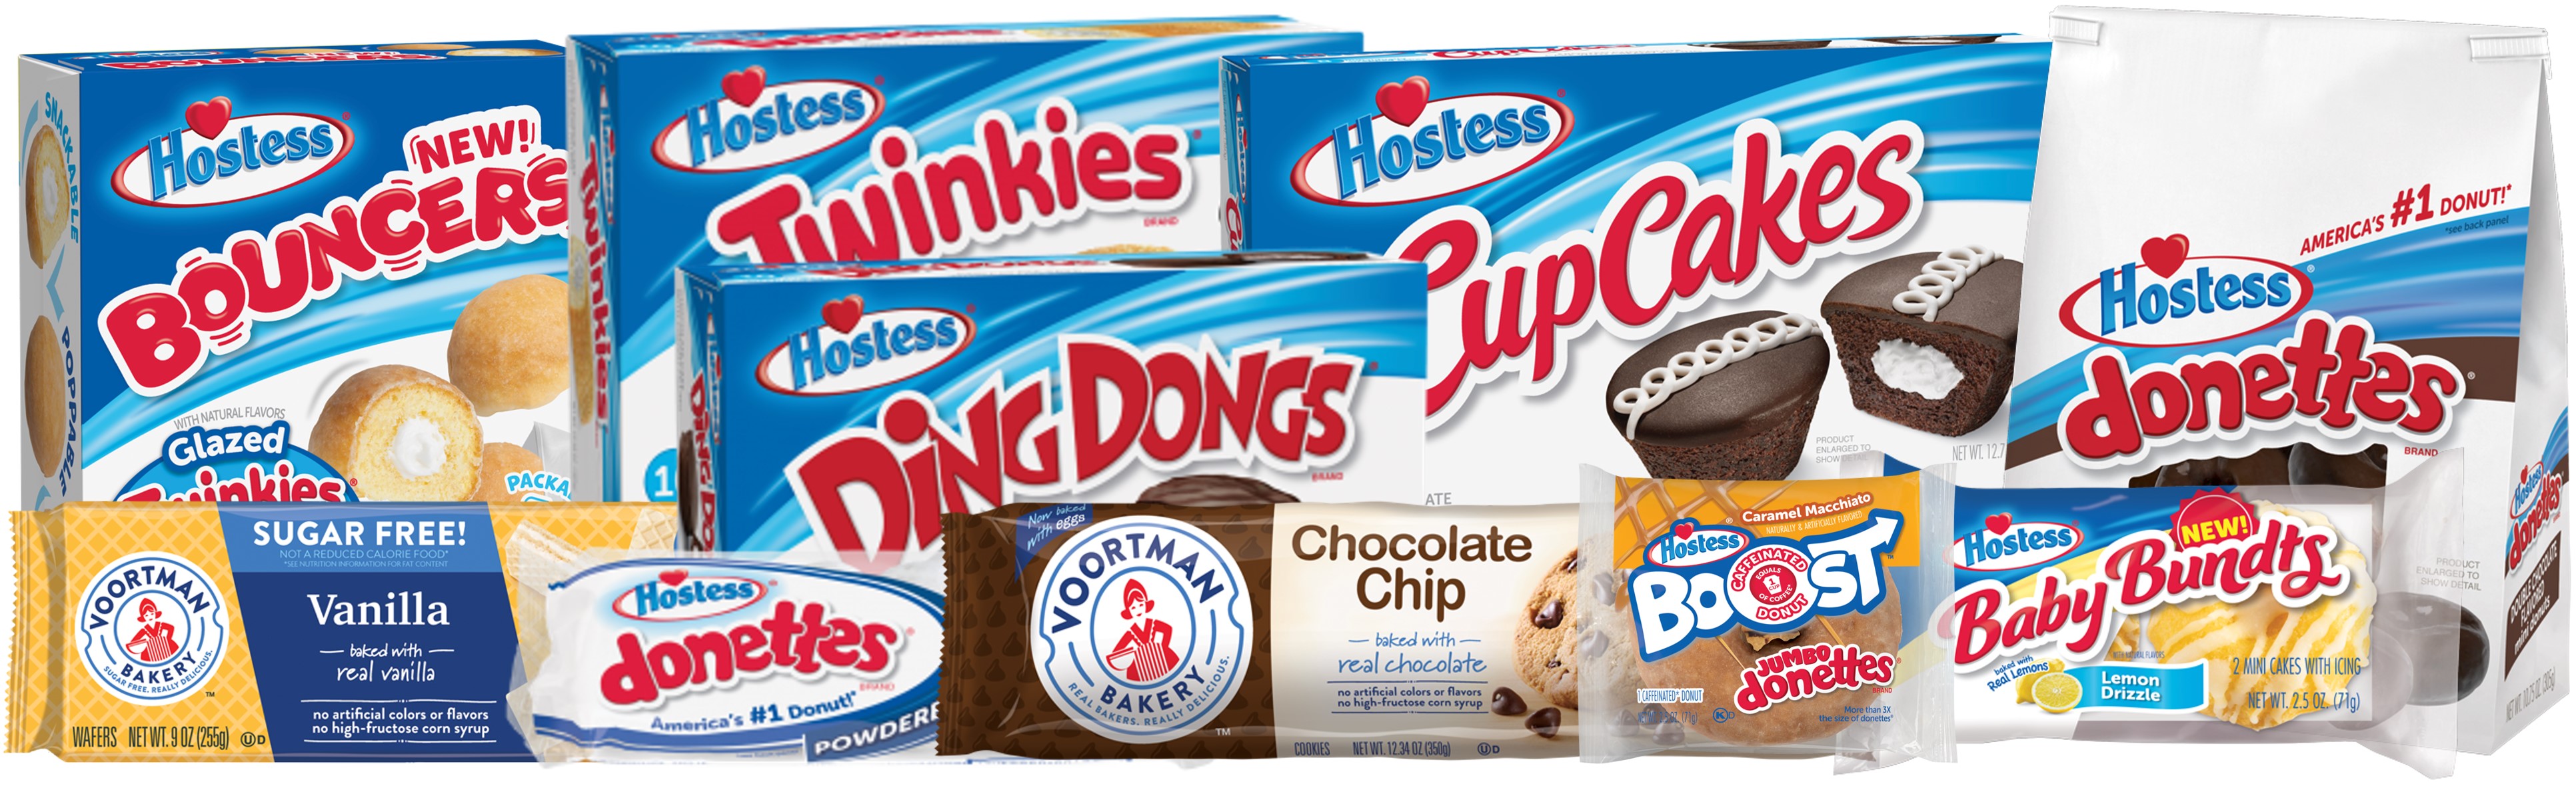
Hostess Brands, Inc. (together with its subsidiaries) (“We” or the “Company”) is a leading sweet snacks company focused on manufacturing, marketing, and distributing snack products in North America sold primarily under the Hostess® and Voortman® brands. We produce a variety of new and classic treats including iconic Hostess® Donettes®, Twinkies®, CupCakes, Ding Dongs®, and Zingers®, as well as Voortman® branded cookies and wafers. Our mission is to inspire moments of joy by putting our  into everything we do. We seek to leverage our iconic brands, pricing power, impactful innovation, efficient manufacturing and distribution model, collaborative customer and strategic sourcing partnerships, and strong cash flows to drive profitable and sustained growth.
 Our business operates in growing categories and snacking occasions, with our best-in-class business model, consumer insights and strong marketing and innovation capabilities. Our Sweet Baked Goods (“SBG”) products represented 21.3% of their category according to Nielsen total universe for the 52-weeks ended January 1, 2022. Our cookie and wafer products represented 1.9% of the adjacent Cookie category, providing a significant opportunity for growth. We believe our strong brand history and market position in the growing spaces in which we compete, combined with our innovative spirit and scalable operating model, provide a strong platform to execute our growth initiatives.
We have invested significantly in retailer and consumer data analytics to identify new opportunities in the spaces in which we compete. These investments, combined with our Direct-to-Warehouse (“DTW”) distribution model, support our leading brand position within the $7.3 billion U.S. SBG category and the adjacent $7.7 billion Cookie category and have increased our reach, paving a path towards future sustained, profitable growth.
Our DTW distribution model uses centralized distribution centers and common carriers to fill orders, with products generally delivered to our customers’ warehouses. This model has eliminated the need for direct-store-delivery (“DSD”) routes and drivers, which allows us to expand our core distribution while gaining access to new channels.
Brands and Products
Hostess® has been an iconic American brand for generations. Our extensive portfolio of timeless and universally recognized names such as Twinkies®, Ho Hos® and Ding Dongs® evokes an emotional affinity with consumers that has the potential to be further unlocked through effective marketing and occasion and consumer-insight based innovation. We produce under our Voortman® brand, which we acquired in 2020, cookie and creme wafer products, including sugar-free varieties. We also produce Dolly Madison®, Cloverhill® and Big Texas® branded products. Our classic treats target different spaces and consumer needs.
Our Growth Strategy
We execute against our growth strategy and strengthen our Hostess® and Voortman® brands by focusing on faster-growing snacking occasions through innovation, marketing, strategic sourcing partnerships and strong partnerships with our customers. We leverage our highly efficient and profitable business model and productivity initiatives to maintain the momentum of our growth fly-wheel, while unlocking our balance sheet to pursue strategic opportunities.
Our Business Sits in Growing Spaces
We compete in growing snacking categories. The $91 billion sweet snacking universe has grown at an annual rate of 4.8% over the last three years1. The number of consumers eating five or more snacks per day has increased double digits since 20182.
The U.S. SBG and Cookie categories combined are a significant portion of this universe, with retail sales of $15 billion according to the Nielsen U.S. total universe for the 52-weeks ended January 1, 2022. The SBG category includes breakfast items (e.g., donuts, breakfast danishes and muffins) and all-day snacking items (e.g., snack cakes, pies, bars and brownies). Our Voortman® branded cookies and wafer products are included in the Cookie category and provide another platform to capitalize on the on-going growth in snacking. Voortman’s products are in the specialty cookie segment and benefit from consumer demand for better-for-you ingredients. With consumers snacking to satisfy hunger, provide an emotional lift and increase social connection, we believe our product portfolio is well positioned to benefit from these broader snacking trends.
We believe that we have maintained the Hostess® brand equity and high awareness for over a century by satisfying consumers’ needs for great-tasting sweet treats. We have established our leadership position in the SBG category through the strength and quality of our products, developing and promoting brands and pricing our products at a reasonable premium to other snacking alternatives.
We plan to capitalize on the strength of our brands and our effective retailer economics to drive growth by attracting new consumers through wide-scale availability, meaningful innovation and targeted marketing. Our market share gains are expected to come from attracting new consumers within our target consumer occasions through our continued investment in quality, targeted marketing, product innovation and a focus on our most effective brands and products. Our brand strategy, combined with investments in highly effective marketing and brand-building, has resulted in what we believe to be one of the strongest brand equities in snacking, evidenced by our 92% brand awareness for Hostess®3.
We continue to launch new partnerships and enter into licensing agreements that leverage our iconic brands. We have partnered with companies in various industries to bring our iconic brands and flavor profiles to complementary products such as popcorn and pudding mixes. Our Voortman® branded products are sold throughout the U.S. and Canada. Both our Hostess® and Voortman® products are distributed by third parties internationally, including products packaged specifically for Mexico and the United Kingdom, among others. In addition, our products are also sold on various e-commerce platforms.
We understand the need to continually evolve while maintaining the traditional offerings our loyal consumer base has come to know and love. We continue to invest in new product development, building our long-term innovation pipeline and leveraging our portfolio and commercialization process to bring new products to market in a timely fashion.
1 NielsenIQ Total Universe select categories through October 2021
2 IRI How America Eats: The Snacking Frenzy in 2021 and Beyond, May 11, 2021, consumers 25-44
3AccuPoll Hostess Brand Tracker, Representative sample of Adults 18-65, N=504
Best in Class Business Model
Our business model is based on the wide availability of our products and unique go-to-market approach, both enabled by our DTW distribution model. The DTW model uses centralized distribution and common carriers. We ship the majority of our products from a centralized distribution center in Edgerton, Kansas. Centralizing our distribution improves visibility and control of distribution and is a key component of our operating model. We utilize other smaller distribution centers focused on certain products or geographic areas. The distribution centers allow us to consolidate inventory and fill customer orders, while reducing overall inventory on-hand as a result of this centralized consolidation of inventory. The majority of our products are delivered to customers’ warehouses from the distribution centers using common carriers.
The DTW model is enabled by our extended shelf life (“ESL”) technology. As a result of our DTW model, we do not keep a significant backlog of finished goods inventory, as our bakery products are promptly shipped to our distribution centers after being produced. Some of our products are shipped frozen at the request of certain customers.
We believe our DTW distribution model allows our products to be everywhere consumers shop for snacks. It provides greater reach into convenience and drug stores. Distributing to these channels under a DSD model can be inefficient due to small average drop size. Historically, DSD sweet baked goods companies have competed with candy and tobacco companies for distribution; however, under our DTW model, we partner with third-party distributors to profitably penetrate both the convenience store and drug store channels. In 2021, the convenience and drug channels accounted for 31.3% of our net revenue. We have established a strong presence and market share in the convenience and drug channels and are focused on continuously expanding coverage. These partnerships further expand our distribution reach in a highly efficient manner, and we believe they will add to our growth potential going forward.
We believe that impulse purchase decisions are another fundamental driver of our retail sales, which makes prominent in-store placement important. The DTW and centralized distribution model provides us with a competitive advantage through the ability to utilize retail-ready corrugate displays. These pre-built displays are visually impactful, economically produced and require minimal in-store labor to assemble or load; thus providing cost-efficient display vehicles that benefit both us and the retailer. Preloaded displays also allow us full control over our branded merchandising and the ability to execute retailer-wide campaigns regionally or nationally in a consistent manner, providing a unique competitive advantage across the entire SBG category, which our competitors predominantly serve through a DSD model.
We have a tailored channel-based go-to-market model that demonstrates key capabilities for growth. We continue to invest in data capabilities, which enable focus on store-level compliance and growth opportunities with our Hostess Partner Program (“HPP”). We also have a unique consortium retail merchandising approach where we partner with brokers to drive in-store performance at lower costs, ensuring strong shelf presence and sending a stream of retail and customer data back to our marketing and sales teams.
Our business model is supported by cost-advantaged manufacturing and distribution, expanded channel/retail store reach and enhanced in-store merchandising capabilities and offers our retail partners attractive margins that incentivize further distribution of our products.
We continue to invest in the business to further our strategic initiatives. Our disciplined capital investment plan focuses on operational capabilities that directly support or expand our growth and innovation with strong return on investment metrics. We are making targeted investments in the production capacity to enable further expansion of our fastest growing product forms. Further, we anticipate continued investment in automation, which allows for improved product quality, consistency and efficiency.
Consumer Capabilities
We leverage our consumer capabilities to drive incremental growth above the category. We strive to meet our consumers at their need states with innovative products and cultivate top-of-mind awareness through efficient digital advertising.
Innovation is key to fueling our growth. We are devoted to maintaining our iconic brands while contemporizing them in order to stay relevant with our consumer base and attract new consumers. We believe that to support our market position, we must continually evolve with changing consumer preferences and trends. We are focused on continuing to innovate and expand our core products by launching new flavors of iconic products and expanding new product forms, pack-sizes and packaging to target faster growing snacking occasions and drive incremental revenue and profit. Our Hostess® Bouncers, which are expected to launch in summer 2022, provide the consumer the same iconic Hostess® cake and filling flavors in a fun, poppable, portable form. Our Hostess® Boost Jumbo Donettes®, which contain the caffeine equivalent of one cup of coffee, launched in the convenience store channel in February 2022 and are on-trend with consumer needs to energize while on the go. The success of our product innovation is in part driven by deeper understanding of consumers’ snacking occasions and providing awareness and trials by partnering with our customers, all while maintaining our iconic brands and product quality.
Our acquisition of Voortman provides us opportunities to respond to additional consumer preferences. Our Hostess® Crispy Minis products were introduced in late 2020 and leverage Voortman’s production capabilities, extending the Hostess® brand into a new bite-size wafer form. In January 2022, we launched Voortman® sugar-free mini cookies and peanut butter wafers, both targeting incremental, younger, health-conscious consumers.
We are increasing our digital advertising to efficiently reach consumers. Our analysis shows that simply reminding consumers about Hostess® could drive incremental sales. As opposed to more traditional media, digital advertising provides us the flexibility and agility to invest in more targeted areas and demographics as we learn about the impact of our programs. This results in an efficient, high-return investment that we expect will drive continued growth.
Execute Strategic Acquisitions to Accelerate Growth
We have a solid platform for growth through acquisitions. Within the broader snacking universe the opportunity exists to drive value creation through acquisitions by leveraging our brand, infrastructure and performance-driven management culture. We are committed to seeking out opportunities that add new capabilities to our already broad offerings.
The acquisition of Voortman in January 2020 diversified and expanded our product offerings and manufacturing capabilities in the attractive, adjacent $7.7 billion Cookie category (based on Nielsen data as of January 1, 2022). The acquisition also leverages our broad customer reach and lean and agile business model. During 2020, we integrated Voortman’s distribution model into our DTW structure, with all Voortman U.S. sales shipping through our centralized distribution center. In addition to sharing established, efficient infrastructure, sales of Voortman® brand products have benefited from the strengthening of collaborative retail partnerships in the United States and Canada.
As we explore other strategic acquisition opportunities, we will consider our ability to leverage our core capabilities to reinvigorate acquired brands and further expand within the wider snacking universe. We will also consider our ability to integrate acquisitions with our existing business and the opportunities to generate synergies through leveraging our existing assets and warehouse model. The successful integration of Voortman exhibits our ability to execute and integrate acquisitions in adjacent categories. We believe our scale, access to capital and management experience will allow us to execute and integrate additional acquisitions.
Competitive Landscape
We compete in the broad snacking universe with a focus on sweet snacks within targeted consumer snacking occasions. Hostess® is the #2 brand in the U.S. SBG category, according to Nielsen retail data. The top three brands, Little Debbie, Hostess® and Entenmann’s account for 66% of the SBG retail sales, while the rest of the category remains fairly fragmented. With limited private label penetration in the category, consumers have shown a strong preference for trusted brands within the SBG category. The leading positions are solidified through extensive product portfolios, strong brand awareness, established distribution capabilities and long-standing relationships with critical high-volume retailers. Furthermore, high levels of capital investment, required to establish manufacturing and distribution capabilities of meaningful scale, provide additional barriers to entry.
Voortman® has the #1 creme wafer and sugar-free cookie products within the larger Cookie category. Nabisco® is the top brand with approximately 43% of the category according to Nielsen. There is higher private label penetration in the Cookie category than the SBG category.
We face competition from other brands, large national bakeries, smaller regional operators and supermarket chains with their own private label brands. The key competitive factors in the industry include product quality, price, brand recognition and loyalty, promotional activities, access to retail outlets, sufficient shelf-space and ability to identify and satisfy consumer preferences. Some of our largest national competitors include Flowers Foods, Inc., Grupo Bimbo, S.A., McKee Foods Corporation and Mondelez International, Inc. In addition, we also compete with regional manufacturers and other companies that produce cookies, candies and other snacks. At times, we experience pricing pressure in certain markets from competitor promotions and other pricing practices. However, we believe our brand recognition, product quality and innovation have generated consumer loyalty to many of our products which helps mitigate this impact.
Seasonality
SBG revenues tend to be moderately seasonal, with declines during the early winter period, which we believe are attributable to altered consumption patterns during the holiday season. We expect this trend to continue to be applicable to our business. We strive to mitigate the seasonality by running certain targeted promotional campaigns.
COVID-19
We continue to monitor the impact of the novel coronavirus (“COVID-19”) pandemic and adjust our operations in response. As discussed further below, as well as in “Risk Factors” included in Item 1A and “Management's Discussion and Analysis of Financial Condition and Results of Operations” in Item 7, we have taken and continue to take actions to respond to the disruptions caused by COVID-19 and to protect the health and well-being of our entire team, their families and the communities we serve.
Production
We have an efficient, agile, resilient and scalable model that delivers quality results. Our products are primarily produced at five bakeries located in Emporia, Kansas; Columbus, Georgia; Indianapolis, Indiana; Chicago, Illinois; and Burlington, Ontario. Our state of the art auto-bake technologies have resulted in significant energy, labor and time savings. The technology provides fully-automated industrial baking ovens and systems, combining cost efficient, compact and continuous baking solutions that can be custom configured. Additionally, we have made high-ROI investments with the installation of new Donette® and cake lines in 2020 and 2021. The majority of our products are shipped through a centralized distribution center in Edgerton, Kansas. This facility was opened in 2020 and has expanded our distribution capacity by 75% and removed two million miles from our distribution network.
With the increase in demand for our products, we continue to make adjustments to our production schedules, product assortment and equipment to maximize production capacity in our existing facilities. We are diligent in our efforts to find opportunities to reduce complexity and drive value within our supply chain. A portion of our products are manufactured and packaged by third parties under our brands and distributed through our facilities.
Raw Materials
Our principal raw materials are cooking oil, sugar, coatings and flour, as well as corrugate and films used to package our products. We utilize various buying strategies to lock in prices for certain raw materials and packaging to reduce the impact of commodity price fluctuations. In addition, we are dependent on natural gas as fuel for firing our ovens. Our third-party common carriers use gasoline and diesel as fuel for their trucks.
We approach sourcing with a holistic strategy to acquire the best quality ingredients and packaging materials at the lowest possible cost. We have strategic, long-term relationships with our key suppliers for our raw materials and packaging that help leverage our buying power. While the cost of some raw materials has, and may continue to increase over time, we believe that we will be able to purchase an adequate supply of raw materials as needed. We also sole source certain raw materials for efficiency. We have multiple vendors that meet our supply requirements for the majority of our sole sourced ingredients. With respect to the sole sourced ingredients for which we do not have multiple vendors to meet our supply requirements, including certain enzymes used in our ESL technology, we are evaluating alternative sources in order to maintain business continuity and flexibility.
Customers
Our top 10 customers in 2021 accounted for 59.5% of total net revenue. During 2021, our largest customer, Wal-Mart and related entities, represented 18.9% of our net revenue. No other customer accounted for more than 10% of 2021 net revenue. The loss of, or a material negative change in, our relationship with Wal-Mart or any of our other top 10 customers could have a material adverse effect on our business. Our customers include mass merchandisers, supermarkets and other retailers and distributors, convenience, drug and dollar stores.
Trademarks and Other Intellectual Property
We believe that our intellectual property has substantial value and has contributed to the success of our business. In particular, our trademarks, including our registered Hostess®, Voortman®, Dolly Madison®, Cloverhill®, and Big Texas® brand trademarks and our sub-brand trademarks, including Twinkies®, Ding Dongs®, Ho Hos®, Zingers®, Sno Balls®, and Donettes®, are valuable assets that we believe reinforce our consumers’ favorable perception of our products. These trademarks have a perpetual life, subject to renewal. This provides us the opportunity to sell our products at premium price points and pursue licensing opportunities.
From time to time, third parties have used names similar to ours, have applied to register trademarks similar to ours and, we believe, have infringed or misappropriated our intellectual property rights. Third parties have also, from time to time, opposed our trademarks and challenged our intellectual property rights. We respond to these actions on a case-by-case basis. We rely on laws and regulations, as well as contractual restrictions, to protect our intellectual property and proprietary rights.
Research and Development
The majority of our research and development spend is dedicated to the development of innovative snack products based on consumer insights and process technology. These products help address new user occasions and seek to bring new consumers into the category based on changing preferences and trends. Through the development timeline, research guidance testing to optimize attributes based on appropriate taste, flavor and texture combined with efficient cost management, helps support our growth. In addition, our research and development organization provides technical support to our manufacturing team to ensure that our core products are consistently produced in accordance with our specifications and high standards of quality. Finally, our research and development department is charged with developing processes to optimize our costs without adversely affecting the quality of our products. During 2020, we opened an innovation lab within our Lenexa, Kansas corporate office. This lab provides us increased rapid prototyping, speed to market and small-scale batch process experimentation along with the testing capabilities, analytics and market research insights needed to support our growth objectives.
Government Regulation
Our operations, including the manufacturing, processing, formulating, packaging, labeling and advertising of products, are subject to regulation by various federal agencies, including the Food and Drug Administration (the “FDA”), the Federal Trade Commission (the “FTC”), and the Environmental Protection Agency (the “EPA”), as well as the Canadian Food Inspection Agency (the “CFIA”) and Health Canada for Canadian Operations. Our products are subject to various local, state, and federal laws, regulations and administrative practices affecting our business. We must comply with provisions regulating registrations and licensing, health and sanitation standards, ingredient standards, current Good Manufacturing Practices and traceability, hazard analysis and risk-based preventative controls, food labeling and advertising, hazard reporting and recall requirements, equal employment, wage and hour requirements, and environmental protection, among others. Also, we are subject to compliance with movement restrictions and other efforts by local governments to mitigate the spread of COVID-19. We take compliance and the safety of our products and employees seriously and take all steps that we consider necessary or appropriate to comply with all applicable laws, rules and regulations.
Human Capital
As of December 31, 2021, we employed approximately 2,600 people. Of our total workforce, approximately 91% were located at our bakeries. The remaining workers comprised functions including operations management, sales and supply chain, among other corporate functions.
Health & Safety
Safety remains our top priority, and we are proud to have achieved the best safety results in our over eight year history. We have improved our total safety record four years running, with 2021 results for key metrics scoring best in class for categories consistent with Occupational Safety & Heath Administration (OSHA) standards. For the full year, we achieved a Total Incident Rate (TIR) of 1.25 vs. Commercial Bakery average of 4.24. We develop and maintain safety policies in our facilities and conduct periodic audits to ensure compliance. We believe new automation, safety investments and behavioral safety training have resulted in higher employee engagement and lower workers’ compensation costs. Managing the global pandemic remains a focus in our health and safety agenda. As established in 2020, our approach to managing the COVID-19 pandemic has been driven by three key principles:
•The safety of our employees, their families, and communities is our top priority
•We’ll continue to service our customers and consumers
•We’ll stay nimble and informed
In 2021, we continued the enhanced cleaning and safety protocols introduced at the beginning of the pandemic, and conduct daily audits of our facilities, ensuring we are following through with our efforts to maintain a safe working environment for our employees amid the COVID-19 pandemic.
Corporate Sustainability
We launched our first Corporate Responsibility Report in May 2021, identifying four key areas of focus for the Company - Governance, Equity & Inclusion, Health and Safety and Environmental. We also highlighted achievements which position us as a responsible, caring member of the communities in which we operate as evidenced through our environmental impact, and community involvement via product and monetary donations and employee volunteer activities.
Labor
Our ability to achieve sustained, profitable results is predicated on our ability to attract, retain, and engage a team of employees aligned on a common purpose: to deliver products that create moments of joy for our customers and consumers. We are committed to providing a safe work environment, competitive wage and benefits packages, career development opportunities and an inclusive culture that encourages each employee to bring their whole self to work.
There were unprecedented labor challenges across the U.S. during 2021 and while this issue impacted us like virtually all employers, we have worked closely with our employees to ensure we can deliver on the promise of our Mission, Vision, and Values in serving our customers and consumers. We have entered into collective bargaining agreements with the Bakery, Confectionery, Tobacco Workers and Grain Millers Union in Indianapolis, Indiana, Columbus, Georgia and Burlington, Ontario; and AFL-CIO and the Chemical Production Workers Union Local No. 30 in Chicago, Illinois. Approximately 1,100 employees are covered by these collective bargaining agreements. We consider our relations with employees to be good and have not experienced a strike or significant work stoppage.
We agreed to a three-year contract in our Indianapolis location in December, 2021, as well as extending the agreement for our Chicago, Illinois bakery by two years, through May 31, 2025.
We offer competitive wages and benefits, including medical, dental, vision, paid parental leave, paid time off, and a number of other programs to best suit the needs of our employees.
Diversity, Equity, Inclusion, & Belonging
To best achieve our desired results, it is vital that employees are comfortable bringing their whole selves to work. We believe diversity, equity, inclusion, and belonging efforts are key to maintaining our positive culture. In addition to training and education at all levels, in 2021 we formed an enterprise-wide DEI&B Team, which identified opportunities to improve our culture, including the planning and execution of celebration and appreciation events for a variety of groups, including the launch of a Speakers Series, programming around culture and appreciation events, and review and enhancement of our diversity policies and practices.
4 Bureau of Labor Statistics, U.S. Department of Labor, Survey of Occupational Injuries and Illnesses, Commercial Bakeries
As of December 31, 2021, our employee demographics in the U.S. were:
| | | | | |
| Total U.S. Hostess Brands | |
| American Indian or Alaska Native | 0.5% |
| Asian | 1.6% |
| Black or African American | 30.8% |
| Decline to State | 2.3% |
| Hispanic or Latino | 29.7% |
| Native Hawaiian or Other Pacific Islander | 0.5% |
| Two or More Races | 0.3% |
| White | 34.3% |
| | | | | |
| Management | |
| American Indian or Alaska Native | 0.3% |
| Asian | 2.3% |
| Black or African American | 14.8% |
| Decline to State | 1.5% |
| Hispanic or Latino | 13.7% |
| Two or More Races | 0.3% |
| White | 67.2% |
Our gender makeup as of December 31, 2021, was: | | | | | |
| Total U.S. Hostess Brands | |
| Female | 40.1% |
| Male | 59.9% |
| | | | | |
| Management | |
| Female | 27.0% |
| Male | 73.0% |
Culture & Engagement
The Company’s culture is an integral part of our strategy, built on creativity, commitment, collaboration, positive energy, and strong sense of ownership. We envision a world where the everyday is worth celebrating. We inspire moments of joy by putting our into everything we do. We launched our Mission, Vision, and Values in May 2021 to ensure everyone on our team understands the purpose of our work. To better understand the full experience of our employees, and to hear what they value, and what they believe could be improved, we launched our first Pulse of Hostess Brands engagement survey in May 2021. Through this process, we identified key themes in every location and department and are engaged in action planning to make our work environment even better. Using both live roundtable sessions with small groups of employees and virtual sessions with executive leadership, we regularly check in with our employees to identify issues needing attention, while sharing key messages with all employees through quarterly Town Hall meetings. In 2021, we also launched the Hostess Hero award, our highest employee honor, which recognizes leadership and character.
Embodying these behaviors is a strong and experienced management team, led by Andy Callahan, our President and Chief Executive Officer. Members of the management team have extensive experience in the consumer packaged goods industry across the sales, operations, marketing, human resources, legal, and finance disciplines.
Our management team is complemented by an experienced Board of Directors, all of whom have senior executive leadership experience and bring with them extensive consumer products knowledge. Our board members and management include:
| | | | | | | | |
| Board of Directors: | | Executive Officers: |
| Jerry D. Kaminski, Chairman | | Andy P. Callahan, President and Chief Executive Officer |
| Andy P. Callahan, Director | | Michael J. Cramer, Executive Vice President, Chief Administrative Officer |
| Olu Beck, Director | | Michael J. Gernigin, Senior Vice President, Chief Accounting Officer and Interim Chief Financial Officer |
| Laurence E. Bodner, Director | | Arist Mastorides, Executive Vice President, Chief Customer Officer |
| Gretchen R. Crist, Director | | Dan O'Leary, Executive Vice President, Chief Growth Officer |
| Rachel P. Cullen, Director | | Darryl P. Riley, Senior Vice President of Quality, Food Safety and R&D |
| Hugh G. Dineen, Director | | Jolyn J. Sebree, Senior Vice President, General Counsel and Secretary |
| Ioannis Skoufalos, Director | | Robert C. Weber, Senior Vice President, Chief People Officer |
| Craig D. Steeneck, Director | | |
A detailed biography of each of our board members and key management team members can be found at www.hostessbrands.com. Unless expressly stated otherwise, the information contained on or accessible through our website is not incorporated by reference into this Annual Report on Form 10-K.
Available Information
This discussion of the business should be read in conjunction with, and is qualified by reference to, Management’s Discussion and Analysis of Financial Condition and Results of Operations (“MD&A”) under Item 7 herein. In addition, the information set forth under the headings “Forward Looking Statements,” and “Introduction” in the MD&A and the segment and geographic information included in Item 8, Financial Statements and Supplementary Data - Note 6. Segment Reporting are incorporated herein by reference in partial response to this Item 1.
The Company’s Internet website address is www.hostessbrands.com. The Company makes available free of charge (other than an investor’s own Internet access charges) through its Internet website its Annual Report on Form 10-K, Quarterly Reports on Form 10-Q, Current Reports on Form 8-K, and amendments to those reports, on the same day they are electronically filed with, or furnished to, the Securities and Exchange Commission (the “SEC”).
The SEC maintains an internet site that contains reports, proxy and information statements, and other information regarding issuers that file electronically with the SEC at http://www.sec.gov. The Company is not including the information contained on or available through its website or the SEC’s website as part of, or incorporating such information by reference into, this Annual Report on Form 10-K.
Item 1A. Risk Factors
You should carefully consider the following risk factors, together with all of the other information included in this Annual Report on Form 10-K. The risks described below are those which we believe are the material risks that we face. Additional risks not presently known to us or which we currently consider immaterial may also have an adverse effect on us. Any risk described below may have a material adverse impact on our business or financial condition. Under these circumstances, the trading price of our Class A common stock could decline, and you may lose all or part of your investment.
RISKS RELATED TO OUR BRANDS, REPUTATION AND COMPETITION
Maintaining, extending and expanding our reputation and brand images are essential to our business success.
We have many iconic brands with long-standing consumer recognition. Our success depends on our ability to maintain our brand images for our existing products, extend our brands to new platforms, and expand our brand image with new product offerings.
We seek to maintain, extend, and expand our brand images through marketing investments, including advertising and consumer promotions, and product innovation. Increasing attention on the role of food marketing could adversely affect our brand images. It could also lead to stricter regulations and greater scrutiny of marketing practices. Existing or increased legal or regulatory restrictions on our labeling, advertising, consumer promotions and marketing, or our response to those restrictions, could limit our efforts to maintain, extend and expand our brands. Moreover, regulatory or legal action against us, product recalls or other adverse publicity could damage our reputation and brand image, undermine our customers’ confidence and reduce long-term demand for our products, even if these actions are unfounded or not material to our operations.
Our reputation could be adversely impacted by the perception that we don't maintain high ethical, social or environmental standards for all of our operations and activities or a perceived negative environmental impact, including use of agricultural materials, packaging, energy use and waste management. In addition, our success in maintaining, extending, and expanding our brand image depends on our ability to adapt to a rapidly changing media environment. We increasingly rely on social media and online dissemination of advertising campaigns. Social and digital media increases the speed and extent that information or misinformation and opinions can be shared. Negative posts or comments about us, our brands or our products on social or digital media, whether or not valid, could seriously damage our brands and reputation. If we do not maintain, extend, and expand our brand image, then our product sales, financial condition and operating results could be materially and adversely affected.
We may be unable to leverage our brand value to compete against lower-priced alternative brands.
In most of our product categories, we compete with lower-priced alternative products. Our products must provide higher value and/or quality to our consumers than alternatives, particularly during periods of economic uncertainty. Consumers may not buy our products if relative differences in value and/or quality between our products and retailer or other economy brands change in favor of competitors’ products or if consumers perceive this type of change. If consumers choose the lower-priced brands, then we could lose market share and sales volumes, which could materially and adversely affect our product sales, financial condition, and operating results.
We may be unable to correctly predict, identify and interpret changes in consumer preferences and demand and offer new products or methods of distribution to meet those changes.
Consumer preferences for food and snacking products continually change. Our success will depend on our ability to predict, identify and interpret the tastes, dietary habits, purchasing behavior and other preferences of consumers and to offer products that appeal to these preferences. Moreover, weak economic conditions, recession or other factors could affect consumer preferences and demand. If we do not offer products that appeal to consumers or if we misjudge consumer preferences and demand for our products, our sales and market share will decrease and our financial condition and operating results could suffer.
We continually introduce new products or product extensions and our operating results and growth will depend upon the market reception of such new products. There can be no assurance that new products will find widespread acceptance among consumers, and unsuccessful product launches may decrease our profitability and damage our brands’ reputation.
The continued prevalence of e-commerce and other methods of distribution outside of traditional retail shopping could also impact our sales and profitability if we are unable to adequately modify the marketing and distribution of our products in response.
In addition, prolonged negative perceptions concerning the health implications of certain food products could influence consumer preferences and acceptance of some of our products and marketing programs. For example, consumers are increasingly focused on health and wellness and are aware of product ingredients such as added sugar and artificial flavors or colors. We might be unsuccessful in our efforts to effectively respond to changing consumer preferences and social expectations.
Our intellectual property rights are valuable, and our failure to protect them could reduce the value of our products and brands.
We consider our intellectual property rights, including our trademarks, trade names, copyrights, trade secrets and trade dress, to be a significant and valuable part of our business. We attempt to protect our intellectual property rights by taking advantage of a combination of applicable laws, registrations of our intellectual property, third-party agreements (including non-disclosures, assignments, distribution and/or manufacturing, licenses, consents and co-existence) and policing and enforcement of third-party misuse or infringement of our intellectual property. Our failure to obtain or adequately protect our intellectual property rights, or any change in law or other changes that serve to lessen or remove the current legal protections of our intellectual property, may diminish our competitiveness and could materially harm our business. In addition, third-party claims of intellectual property infringement might require us to pay monetary damages or enter into costly license agreements. We also may be subject to injunctions against development and sale of certain of our products.
Any litigation regarding intellectual property (including third-party infringement claims or litigation initiated by us to protect our intellectual property rights) could be costly and time-consuming and could divert management’s and other key personnel’s attention from our business operations. Any of the occurrences outlined above could materially and adversely affect our reputation, product sales, financial condition and operating results.
We operate in a highly competitive industry.
The snacking industry is highly competitive. Numerous brands and products compete for shelf space and sales, with competition based primarily on product quality, brand recognition and loyalty, price, trade promotion, consumer promotion, and the ability to identify and satisfy emerging consumer preferences. We face competition from other large national brands, smaller regional operators, supermarket chains with their own private labeled brands and diversified food companies. Our competitors include a significant number of companies of varying sizes, including divisions, subdivisions, or subsidiaries of larger companies. Many of these competitors have multiple product lines, substantially greater financial and other resources available to them, and may be substantially less leveraged than us. We may not be able to compete successfully with these companies. Competitive pressures or other factors could cause us to lose market share, which may require us to lower prices, increase marketing and advertising expenditures, or increase the use of discounting or promotional campaigns, each of which could materially and adversely affect our margins and could result in an adverse effect to our financial condition and operating results.
Our success will depend on our continued ability to produce and successfully market products with extended shelf life.
We have invested to extend our product shelf life, while maintaining our products’ taste, texture and quality. Extended shelf life, or ESL, is an important component of our DTW model. Our ability to produce and successfully market existing and new products with ESL, while maintaining taste, texture and quality, is essential to our success. If we are unable to continue to produce products with ESL or if the products are not accepted by consumers, we could be forced to make changes to our distribution model or products that could have an adverse effect on our product sales, financial condition and operating results.
We may be limited in our ability to pass cost increases on to our customers in the form of price increases.
We may not be able to pass some or all of any increases in the price of raw materials, labor, energy, and other input costs to our customers by raising prices. In the event we increase our prices, customers and consumers may choose to purchase competing products or may shift purchases to private label or other lower-priced offerings, which may adversely affect our financial condition and operating results.
We may realize a decrease in sales volume in the event price increases are implemented.
Consumers may be less willing or able to pay a price differential for our branded products, and may increasingly purchase lower-priced offerings and may forego some purchases altogether. Retailers may also increase levels of promotional activity for lower-priced offerings as they seek to maintain sales volumes. Accordingly, sales volumes of our branded products could be reduced or lead to a shift in sales mix toward our lower-margin offerings. As a result, decreased demand for our products may adversely affect our financial condition and operating results.
RISKS RELATED TO OUR GROWTH STRATEGIES
Our growth may be limited by our inability to maintain or add additional shelf or retail space for our products.
Our results will depend on our ability to drive revenue growth, in part, by expanding the distribution channels for our products. However, our ability to do so may be limited by our inability to secure additional shelf, display, or other retail space for our products. Retail space for snacks is limited and subject to competitive and other pressures, and there can be no assurance that retail operators will provide us sufficient space for our products to enable us to meet our growth objectives. If we are unable to maintain or increase our retail space we could experience an adverse impact on our product sales, financial condition and operating results.
We may not successfully identify or complete strategic acquisitions, alliances, divestitures or joint ventures.
From time to time, we may evaluate acquisition candidates, alliances or joint ventures that may strategically fit our business objectives, or we may consider divesting businesses that no longer meet our strategic objectives, growth or profitability targets. These activities may present financial, managerial, and operational risks, including, but not limited to, diversion of management’s attention from existing core businesses. In addition, to the extent we undertake acquisitions, alliances or joint ventures or other developments outside our core geography or in new categories, we may face additional risks related to such developments. Any of these factors could materially and adversely affect our product sales, financial condition, and operating results.
We may not successfully integrate and manage our acquired businesses or brands.
From time to time, we acquire businesses or brands to expand our product portfolio and distribution. We may incur unforeseen liabilities and obligations in connection with the acquisition, integration, or management of the acquired businesses or brands and may encounter unexpected difficulties and costs in integrating them into our operating and internal control structures. We may also experience delays in extending our internal control over financial reporting to a newly acquired business, which may increase the risk of failure to prevent misstatements in their financial records and in our consolidated financial statements. Our financial performance depends in large part on how well we can manage and improve the performance of acquired businesses or brands. We cannot assure you, however, that we will be able to achieve our strategic and financial objectives for such acquisitions. If we are unable to achieve such objectives or successfully integrate acquired businesses or brands, our financial condition and operating results could be negatively affected.
We may be unable to drive revenue growth in our key products or add products that are faster-growing and more profitable.
The snacking industry’s overall growth is linked to population growth. Our future results will depend on our ability to drive revenue growth in our key products. Because our operations are concentrated in the North American snacking industry, our success also depends in part on our ability to enhance our portfolio by adding innovative new products. There can be no assurance that we will be able to effectively manufacture or source new products or that new products will find widespread acceptance among consumers. Our failure to drive revenue growth in our key products or develop innovative new products could materially and adversely affect our profitability, financial condition and operating results.
RISKS RELATED TO OUR OPERATIONS
The current COVID-19 pandemic, or the future outbreak of other highly infectious or contagious diseases, could adversely impact or cause disruption to our business, financial condition, results of operations and cash flows. Further, the COVID-19 pandemic, which has caused severe disruptions in the U.S. and global economy, may further disrupt financial markets and could potentially create widespread business continuity issues.
In response to COVID-19, certain governmental authorities have issued orders, proclamations and/or directives aimed at minimizing the spread of the pandemic. More restrictive proclamations and/or directives may be issued in the future. As a food producer, we are an essential service and the majority of our employees continue to work within our bakeries and distribution facilities. However, we have had increased labor costs resulting from the payment of overtime to certain of our employees while other employees have been on paid sick leave or unpaid leaves of absence. We have also incurred expenses related to additional sanitization and safety measures we have instituted throughout our facilities. Although the temporary reductions in production at our bakeries to enable sanitization and implementation of our other safety and employee welfare programs have not materially affected our operations, other food producers have experienced significant shutdowns of production. We cannot assure you that our health and safety measures will prevent a widespread outbreak of COVID-19 at our facilities. Such an outbreak could lead to a suspension of production or increased labor and other costs, each of which could have a material adverse effect on our business, financial condition and results of operations.
We are actively monitoring the potential impact of the pandemic on our operations and distribution. Our products are manufactured in North America, and we may experience disruptions to our operations including in our supply chain and in our ability to obtain ingredients, packaging, and other sourced materials due to labor shortages, governmental restrictions, or the failure of our suppliers, distributors, or manufacturers to meet their obligations to us. We are unable to accurately predict the impact that the coronavirus will have due to various uncertainties, including the severity of the disease and its potential variants, the duration of outbreaks, the effectiveness of vaccines or other treatments and actions that may be taken by governmental authorities. We also cannot predict the effects of any future outbreak of other highly infectious or contagious diseases.
The impacts of the COVID-19 pandemic could exacerbate conditions in our other risk factors noted in this Item 1A, “Risk Factors.” If we are unable to successfully manage our business through the challenges and uncertainties created by the COVID-19 pandemic, many of which are not within our control, our business, financial condition and operating results could be materially adversely affected.
The cost to manufacture our products is subject to pricing volatility.
We purchase and use large quantities of commodities, including flour, sweeteners, edible oils and compound coating to manufacture our products. In addition, we purchase and use significant quantities of corrugate and films to package our products.
Prices for commodities, labor, energy, transportation and other inputs are volatile and can fluctuate due to inflationary pressures that are difficult to predict, including global competition for resources, currency fluctuations, severe weather, the potential effects of climate change, consumer, industrial or investment demand, and changes in regulatory, trade, alternative energy, or agricultural policies. Rising commodity, energy, transportation and other input costs could materially and adversely affect our cost of operations, which could materially and adversely affect our financial condition and operating results.
We monitor our exposure to commodity prices as an integral part of our overall risk management program, and seek to utilize forward buying strategies through short-term and long-term advance purchase contracts, to lock in prices for certain high-volume raw materials, packaging components and fuel inputs. These strategies, however, may not protect us from increases in specific raw materials costs.
Damage or disruption to our supply chain, including third-party manufacturing or transportation and distribution capabilities, due to weather, including any potential effects of climate change, natural disaster, fire or explosion, terrorism, pandemics (such as the COVID-19 pandemic), strikes, government action, or other reasons beyond our control or the control of our suppliers and business partners, could impair our ability to manufacture or sell our products. Failure to take adequate steps to mitigate the likelihood or potential impact of such events, or to effectively manage such events if they occur, particularly when a product is sourced from a single supplier or location, could adversely affect our business, financial condition and operating results.
In addition, disputes with significant suppliers, including disputes regarding pricing or performance, could adversely affect our ability to supply products to our customers and could materially and adversely affect our product sales, financial condition, and results of operations.
We source the significant majority of our ingredients, raw materials and packaging within North America. However, global supply may become constrained, which may cause the price of certain ingredients, raw materials and packaging used in our products to increase, such ingredients may become unavailable and/or we may experience disruptions to our operations.
Continued volatility or sustained increases in the prices of commodities, transportation and other supplies we purchase could increase the costs of our products, and our profitability could suffer. Moreover, increases in the prices of our products to cover these increased costs may result in lower sales volumes. If we are not successful in our buying strategies and production efficiencies, or if we are unable to price our products to cover increased costs, then commodity and other input price volatility or increases could materially and adversely affect our financial condition and operating results.
The loss of one or more of our current co-manufacturing arrangements could adversely affect our business.
We use independent contract manufacturers, or co-manufacturers, to manufacture a portion of our products. In some cases, an individual co-manufacturer may produce all of our requirements for a particular product. There are a limited number of qualified co-manufacturers in the industry. Therefore, if we lose or need to change one or more co-manufacturers or fail to retain co-manufacturers for newly acquired or developed products or brands, production of our products may be delayed or postponed and/or the availability of some of our products may be reduced or eliminated, which could have a material adverse effect on our business, financial condition and operating results.
The ability to distribute our products is subject to significant changes in the availability and pricing of transportation.
We utilize third-party carriers to ship our products to our distribution centers and to customers. The availability of timely and reliable transportation and the associated costs are subject to market demand, carrier capacity, fuel prices and regulatory oversight. Our procurement of transportation services from a diversified group of carriers and continuous monitoring of carrier usage and pricing could be insufficient to protect us from changes in market demand or carrier capacity. The inability to distribute our products in a cost effective manner could have a material adverse effect on our business, financial condition and operating results.
Climate change may negatively affect our business and operations.
There is growing concern that carbon dioxide and other greenhouse gases in the atmosphere may have an adverse impact on global temperatures, weather patterns, and the frequency and severity of extreme weather and natural disasters. In the event that such climate change has a negative effect on agricultural productivity, we may be subject to decreased availability or less favorable pricing for certain commodities that are necessary for our products, such as sugar and wheat. Adverse weather conditions and natural disasters can reduce crop size and crop quality, which in turn could reduce our supplies of raw materials, lower recoveries of usable raw materials, increase the prices of our raw materials, increase our cost of transporting and storing raw materials, or disrupt our production schedules. As a result of climate change, we may also be subjected to decreased availability of water, deteriorated quality of water or less favorable pricing for water, which could adversely affect our financial condition and operating results.
If we lose one or more of our major customers, or if any of our major customers experience significant business interruption, our operating results could be adversely affected.
We have several large customers that account for a significant portion of our sales. Wal-Mart together with its affiliates is our largest customer and represented approximately 18.9% of our net revenue for the year ended December 31, 2021. Cumulatively, including Wal-Mart, our top ten customers accounted for 59.5% of total net revenue for the year ended December 31, 2021.
We do not have long-term supply contracts with any of our major customers. The loss of one or more major customers, a material reduction in sales to these customers for any reason, including but not limited to, a significant business interruption of our customers’ operations or our inability to forecast demand and plan production to fulfill customer orders would result in a decrease in our product sales, financial condition and operating results.
Our results could be adversely impacted as a result of increased labor and employee-related expenses.
Inflationary pressures and any shortages in the labor market have increased and may continue to increase labor costs or constrain production capacity, which could have a material adverse effect on our consolidated operating results or financial condition. While we have historically experienced some level of ordinary course turnover of employees, the COVID-19 pandemic and resulting actions and impacts have exacerbated labor shortages and increased turnover. A number of factors have had and may continue to have adverse effects on the labor force available to us, including reduced employment pools, federal unemployment subsidies, including unemployment benefits offered in response to the COVID-19 pandemic, and other government regulations, which include laws and regulations related to workers’ health and safety, wage and hour practices and immigration. Our labor costs include the cost of providing employee benefits, including health and welfare, and severance benefits. The annual costs of benefits vary with increased costs of health care and the outcome of collectively-bargained wage and benefit agreements. Labor shortages and increased turnover rates within our team members have led to and could in the future lead to increased costs, such as increased overtime to meet demand and increased wage rates to attract and retain employees, and could negatively affect our ability to efficiently operate our bakeries or otherwise operate at full capacity. An overall or prolonged labor shortage, lack of skilled labor, increased turnover or labor inflation could have a material adverse impact on our financial condition and operating results.
Various federal and state labor laws govern our relationships with our employees and affect operating costs. These laws include employee classifications as exempt or non-exempt, minimum wage requirements, unemployment tax rates, workers’ compensation rates, overtime, family leave, safety standards, payroll taxes, citizenship requirements and other wage and benefit requirements for employees classified as non-exempt. As our employees are paid at rates set above, but related to, the applicable minimum wage, further increases in the minimum wage could increase our labor costs. Significant additional government regulations could materially and adversely affect our business, financial condition and operating results.
A portion of our workforce belongs to unions. Failure to successfully negotiate collective bargaining agreements, or strikes or work stoppages could cause our business to suffer.
Approximately 44% of our employees, as of December 31, 2021, are covered by collective bargaining agreements and other employees may seek to be covered by collective bargaining agreements. Strikes or work stoppages or other business interruptions could occur if we are unable to renew these agreements on satisfactory terms or enter into new agreements on satisfactory terms, which could impair manufacturing and distribution of our products or result in a loss of sales, which could adversely impact our business, financial condition or operating results. The terms and conditions of existing, renegotiated or new collective bargaining agreements could also increase our costs or otherwise affect our ability to fully implement future operational changes to enhance our efficiency or to adapt to changing business needs or strategy, which could have an adverse effect to our financial condition and operating results.
We may be subject to product liability claims should the consumption of any of our products cause injury, illness or death.
We sell food products for human consumption, which involves risks such as product contamination or spoilage, mislabeling, product tampering and other adulteration of food products. Consumption of a mislabeled, adulterated, contaminated or spoiled product may result in personal illness or injury. We could be subject to claims or lawsuits relating to an actual or alleged illness or injury, and we could incur liabilities that are not insured or exceed our insurance coverage. Even if product liability claims against us are not successful or fully pursued, these claims could be costly and time consuming and may require our management to spend time defending the claims rather than operating the business. In addition, publicity regarding these claims could adversely affect our reputation and brands.
Product recalls may increase our costs, negatively impact our brands’ reputation, and adversely affect our business.
A product that has been actually or allegedly misbranded or becomes adulterated could result in product withdrawals or recalls, destruction of product inventory, negative publicity, temporary plant closings, substantial cost of compliance or remediation, and potentially significant product liability judgments against us. Any of these events could result in a loss of demand for our products, which would have a material adverse effect on our financial condition and operating results. While we carry insurance to cover the direct costs of such events, we cannot guarantee that these costs will be recovered. We could also be adversely affected if consumers lose confidence in our product quality, safety and integrity generally.
We rely on third parties for services related to sales, marketing and distribution.
We utilize third-party brokerage and merchandising services and common carriers to execute order fulfillment for the majority of our products. While these services have increased our market penetration and expanded our distribution reach, we are dependent upon these third parties to effectively market, sell and distribute our products. We do not have long-term contracts with any of these third-party service providers. Accordingly, any termination by a third-party provider of their services to us, or any failure by these third parties to perform their obligations to us, would have a material adverse impact on our financial condition and operating results.
RISKS RELATED TO OUR INDUSTRY AND ECONOMIC CONDITIONS
The COVID-19 pandemic has caused severe disruptions in the U.S. and global economy, may further disrupt financial markets and could potentially create widespread business continuity issues.
In response to the COVID-19 pandemic, certain governmental authorities have issued orders, proclamations and/or directives aimed at minimizing the spread of the pandemic. Additional, more restrictive proclamations and/or directives may be issued in the future. We cannot predict the economic impact of additional waves of COVID-19 infections or governmental measures and directives in response thereto. Although several vaccines for COVID-19 have been developed, the effectiveness and public acceptance of the vaccines remain uncertain. While we do not expect that the virus will have a material adverse effect on our financial condition and operating results at this time, we are unable to accurately predict the impact that the coronavirus will have due to various uncertainties, including new variants of the virus and their severity, the duration of the outbreak, the economic impact on our customers, and
actions that may be taken by governmental authorities. We also cannot predict the effects of another wave of COVID-19 or any future outbreak of other highly infectious or contagious diseases.
Our geographic focus makes us particularly vulnerable to economic and other events and trends in North America.
We operate in North America and are particularly susceptible to adverse United States regulations, trade policies, economic climate, consumer trends, market fluctuations, including commodity price fluctuations or supply shortages of our ingredients and other production inputs, and other adverse events. The concentration of our businesses in North America could present challenges and may increase the likelihood that an adverse event in the United States would materially and adversely affect our product sales, financial condition and operating results.
The consolidation of retail customers could adversely affect us.
Retail customers may continue to consolidate, resulting in fewer customers for our business. Consolidation also produces larger retail customers that may seek to leverage their position to improve their profitability by demanding improved efficiency, lower pricing, increased promotional programs, or specifically tailored products. In addition, larger retailers have the scale to develop supply chains that permit them to operate with reduced inventories or to develop and market their own retailer brands. Retail consolidation and increased retailer power could materially and adversely affect our product sales, financial condition, and operating results.
Retail consolidation also increases the risk that adverse changes in our customers’ business operations or financial performance will have a corresponding material and adverse effect on us. For example, if our customers cannot access sufficient funds or financing, then they may delay, decrease, or cancel purchases of our products, or delay or fail to pay us for previous purchases, which could materially and adversely affect our product sales, financial condition, and operating results.
OTHER GENERAL RISKS RELATED TO OUR BUSINESS
Unsuccessful implementation of business strategies to reduce costs may adversely affect our business, financial condition, results of operations and cash flows.
Many of our costs, such as freight, raw materials and energy, are subject to factors outside of our control. Therefore, we must seek to reduce costs in other areas, such as through operating efficiency. If we are not able to complete projects designed to reduce costs and increase operating efficiency on time or within budget, our business, financial condition, results of operations and cash flows may be adversely impacted. In addition, if the cost-saving initiatives we have implemented, or any future cost-saving initiatives, do not generate the expected cost savings and synergies, our business, financial condition and operating results may be adversely affected.
Legal claims or other regulatory enforcement actions could subject us to civil and criminal penalties.
As a large food company, we operate in a highly regulated environment with constantly evolving legal and regulatory frameworks. Various laws and regulations govern food production, storage, distribution, sales, labeling, advertising and marketing, as well as licensing, trade, labor, tax and environmental matters, and health and safety practices. Government authorities regularly change laws and regulations and their interpretations. Consequently, we are subject to heightened risk of legal claims or other regulatory enforcement actions. Although we have implemented policies and procedures designed to ensure compliance with existing laws and regulations, there can be no assurance that our employees, contractors, or agents will not violate our policies and procedures. Moreover, a failure to maintain effective control processes could lead to violations, unintentional or otherwise, of laws and regulations. Legal claims or regulatory enforcement actions arising out of our failure or alleged failure to comply with applicable laws and regulations could subject us to civil and criminal penalties that could materially and adversely affect our product sales, reputation, financial condition and operating results.
We are subject to laws and regulations relating to protection of the environment, worker health, and workplace safety. Costs to comply with these laws and regulations, or claims with respect to environmental, health and safety matters, could have a significant negative impact on our business.
Our operations are subject to various federal, state and local laws and regulations relating to the protection of the environment, including those governing the discharge of pollutants into the air and water, the management and disposal of solid and hazardous materials and wastes, employee exposure to hazards in the workplace and the cleanup of contaminated sites. We are required to obtain and comply with environmental permits for many of our operations, and sometimes we are required to install pollution control equipment or to implement operational changes to limit air emissions or wastewater discharges and/or decrease the likelihood of accidental releases of hazardous materials.
We could incur substantial costs, including cleanup costs, civil or criminal fines or penalties, and third-party claims for property damage or personal injury as a result of any violations of environmental laws and regulations, noncompliance with environmental permit conditions or contamination for which we may be responsible that is identified or that may occur in the future. The increasing concern over climate change also may result in more regional, federal, and/or global legal and regulatory requirements to reduce or mitigate the effects of greenhouse gases and replenish water. If such laws are enacted, we may experience significant increases in our costs of operation and delivery. In particular, increasing regulation of fuel emissions could substantially increase the distribution and supply chain costs associated with our products.
Under federal and state environmental laws, we may be liable for the costs of investigation, removal or remediation of certain hazardous or toxic substances, as well as related costs of investigation and damage to natural resources, at various properties, including our current and former properties and the former properties of our predecessors, as well as off-site waste handling or disposal sites that we or our predecessors have used. Liability may be imposed upon us without regard to whether we knew of or caused the presence of such hazardous or toxic substances. Any such locations we currently own or occupy, or locations that we may acquire in the future, may result in liability to us under such laws or expose us to third-party actions such as tort suits based on alleged conduct or environmental conditions. In addition, we may be liable if hazardous or toxic substances migrate from properties for which we may be responsible to other properties.
In addition to regulations applicable to our operations, failure by any of our suppliers to comply with regulations, or allegations of compliance failure, may disrupt their operations and could result in potential liability. Even if we were able to obtain insurance coverage or compensation for any losses or damages resulting from the noncompliance of a supplier with applicable regulations, our brands and reputation may be adversely affected by negative perceptions of our brands stemming from such compliance failures.
We cannot predict what environmental or health and safety legislation or regulations will be enacted in the future or how existing or future laws or regulations will be enforced, administered or interpreted. We also cannot predict the amount of future expenditures that may be required in order to comply with such environmental or health and safety laws or regulations or to respond to environmental claims. These potential expenses could have a material adverse effect on our financial condition and operating results.
Our operations are subject to regulation by the FDA, FTC and other governmental entities, and such regulations are subject to change from time to time which could impact how we manage our production and sale of products.
Our and our contract manufacturers’ operations are subject to extensive regulation by the FDA, the FTC and other national, state, and local authorities in the U.S., as well as the CFIA and provincial and local authorities in Canada. For example, we are subject to the Food, Drug and Cosmetics Act (“FDCA”) and regulations promulgated thereunder by the FDA. This comprehensive regulatory program governs, among other things, the registration of all points in the food supply chain, manufacturing, processing, composition and ingredients, labeling, packaging, holding, distribution and safety of food. Under this program, the FDA regulates manufacturing practices for foods through, among other things, its current “good manufacturing practices” regulations, or cGMPs, and specifies the ingredients for certain foods. Our bakeries and products are subject to periodic inspection by federal, state, and local authorities. The Food Safety Modernization Act increased the number of inspections at food facilities in the United States in an effort to enhance the detection of food-borne illness outbreaks and order recalls of tainted food products. It also imposes greater responsibility upon parties throughout the food chain to design and implement effective
hazard analysis and preventive control programs in food safety programs throughout the supply chain. Failure to follow cGMPs and have an adequate food safety program results in food being adulterated and could require product recalls. The FDCA requires certain reports of hazardous food products to be submitted to the FDA and provides authority to the FDA to take corrective action including recall of adulterated or misbranded food products.
Similarly, the bakery in Burlington, Ontario is subject to the Canadian Food and Drugs Act (“CFDA”) and the Safe Food for Canadian’s Act (“SFCA”) and regulations promulgated thereunder by Health Canada and the CFIA. The CFDA and SFCA govern the import, export, manufacture, distribution, composition, packaging, labelling, advertising, and sale of food products in Canada. Under the SFCA, the CFIA, among other things, issues licenses for the importation, manufacturing, processing, packaging and labelling of foods, and enforces requirements for food safety, preventive controls, traceability, and product complaints, investigations and recalls. Failure to implement appropriate preventive controls and have an adequate food safety program may result in food being unsafe and could require product recalls. Under the SFCA, companies are required to report to the CFIA if a food presents a risk of injury to human health, whether due to adulteration or misbranding, and CFIA has authority to take corrective action including recall of the affected food products.
The FDA also has extensive and specific regulations concerning food labeling, including use of certain terms such as sugar free, healthy, low sodium and low fat. Improper labeling of a food causes it to be misbranded and could result in a recall. Under the FDCA, the FDA can issue a Warning Letter or Untitled Letter, or take other regulatory action such as a product seizure and detention, product recall, refuse to allow the export of the product, or with the Department of Justice, criminal or civil penalties, injunction against or restriction of product manufacture or distribution, consent decrees, disgorgement, restitution, against misbranded or adulterated food products. The FTC and state authorities regulate how we market and advertise our products, and we could be the target of claims relating to alleged false or deceptive advertising under federal, state, and foreign laws and regulations. In Canada, the CFIA enforces the detailed labelling and advertising requirements and restrictions promulgated under the CFDA and the SFCA, and has broad authority to take regulatory action such as product seizure and detention, stop sale, product recall, license suspension, impose administrative monetary penalties or pursue criminal prosecution for noncompliant food product or food advertising that is allegedly false or deceptive. Changes in these laws or regulations or the introduction of new laws or regulations could increase the costs of doing business for us or our customers or suppliers or restrict our actions, causing our financial condition and operating results to be adversely affected.
We seek to comply with applicable laws and regulations through a combination of employing internal personnel to ensure quality-assurance and food safety programs compliance and contracting with third-party laboratories. Compliance with regulations is costly and time-consuming. From time to time, we have been subject to civil claims alleging that we failed to comply with applicable laws and regulations. Any failure to comply or maintain permits and licenses relating to our operations could subject us to fines, injunctions, recalls or seizures, as well as potential criminal sanctions or suspensions or revocations of our registration, permits or licenses, which could result in increased operating costs that have a material adverse effect on our business, financial condition and operating results.
Significant additional labeling or warning requirements or limitations on the marketing or sale of our products may reduce demand for such products and could adversely affect our business or operating results.
Certain jurisdictions in which our products are made, manufactured, distributed or sold have either imposed, or are considering imposing, product labeling or warning requirements or limitations on the marketing or sale of certain of our products as a result of ingredients or substances contained in such products. These types of provisions have required that we provide a label that highlights perceived concerns about a product or warns consumers to avoid consumption of certain ingredients or substances present in our products and have also prohibited or limited the use of certain words or phrases in connection with describing a product’s qualities. For example, in California, Proposition 65 requires a specific warning on any product that contains a substance listed by the State of California as having been found to cause cancer or birth defects, unless the level of such substance in the product is below a safe harbor level. We have been subject to civil claims alleging non-compliance with these requirements and may be subject to such claims in the future.
In addition, the United States imposed nutrition labeling regulations that required large food manufacturers to declare the quantity of added sugar by January 1, 2020, as well as a national bio-engineered food disclosure standard that required food manufacturers to disclose bio-engineered food ingredients by January 1, 2022. Our new product labeling may impact the consumption and public perception of our products.
The imposition or proposed imposition of additional product labeling or warning requirements could reduce overall consumption of our products, lead to negative publicity (whether based in scientific fact or not) or leave consumers with the perception (whether or not valid) that our products do not meet their health and wellness needs. Such factors could adversely affect our business, financial conditions and operating results.
A material impairment in the carrying value of acquired goodwill or other intangible assets could negatively affect our consolidated operating results and net worth.
A significant portion of our assets are goodwill and other intangible assets, the majority of which are not amortized but are reviewed for impairment at least annually and more often if indicators of impairment exist. If the carrying value of these assets exceeds the current estimated fair value, the asset is considered impaired, and this would result in a non-cash charge to earnings, which could be material. Events and conditions that could result in impairment include a sustained drop in the market price of our Class A common stock, increased competition or loss of market share, obsolescence, product claims that result in a significant loss of sales or profitability over the product life, deterioration in macroeconomic conditions, or declining financial performance in comparison to projected results.
Our business operations could be disrupted if our information technology systems fail to perform adequately.
The efficient operation of our business depends on our information technology systems, most of which are managed by third-party service providers. We rely on our information technology systems to effectively manage our business data, communications, supply chain, order entry and fulfillment, and other business processes. The failure of our information technology systems to perform as we anticipate could disrupt our business and could result in transaction errors, processing inefficiencies, and the loss of sales and customers, causing our business and operating results to suffer. In addition, our information technology systems may be vulnerable to damage or interruption from circumstances beyond our control, including fire, natural disasters, the potential effects of climate change, power outages, systems failures, security breaches, cyber-attacks and viruses. Any such damage or interruption could have a material adverse effect on our business, financial condition and operating results.
We continuously monitor and update our information technology networks and infrastructure to prevent, detect, address and mitigate the risk of unauthorized access, misuse, and other events that could have a security impact. We invest to protect our data and business processes against risk of data security breach and cyber-attacks. We believe our security processes provide adequate measures of protection against security breaches. Nevertheless, despite continued vigilance in these areas, disruptions in information technology systems, including unauthorized use of data, are possible and could have a negative impact on our operations or business reputation. Failure of our systems, including failures due to cyber-attacks that would prevent the ability of systems to function as intended, could cause transaction errors, loss of customers and sales, and could have negative consequences to our operations, our employees and those with whom we do business. This in turn could have a negative impact on our financial condition and operating results.
We may be unable to hire or retain and develop key personnel or a highly skilled and diverse workforce or manage changes in our workforce.
We must hire, retain and develop a highly skilled and diverse workforce. We compete to hire new personnel in the many regions in which we manufacture and market our products and then to develop and retain their skills and competencies. Unplanned turnover or failure to develop adequate succession plans for leadership positions or hire and retain a diverse workforce with the skills and in the locations we need to operate and grow our business could deplete our institutional knowledge base and erode our competitiveness.
We also face increased personnel-related risks. These risks could lead to operational challenges, including increased competition for employees with the skills we require to achieve our business goals, and higher employee turnover, including employees with key capabilities. Furthermore, we might be unable to manage changes in, or that affect, our workforce appropriately or satisfy the legal requirements associated with how we manage and compensate our employees. These risks could materially and adversely affect our reputation, ability to meet the needs of our customers, product sales, financial condition and operating results.
Risks Related to Our Capital Structure
Our substantial leverage could adversely affect our ability to raise additional capital to fund our operations, limit our ability to react to changes in the economy or our industry, expose us to interest rate risk to the extent of our variable rate debt, and prevent us from meeting our obligations under our indebtedness.
As of December 31, 2021, our total balance on long term debt, excluding deferred financing charges, discount, premium, and lease obligations, was $1,091.6 million. Our degree of leverage could have important consequences, including:
•requiring a substantial portion of cash flow from operations to be dedicated to the payment of principal and interest on our indebtedness, thereby reducing our ability to use our cash flow to fund our operations, capital expenditures, and future business opportunities or to pay dividends;
•exposing us to the risk of increased interest rates because the portion of our borrowings not hedged by swap agreements are subject to variable rates;
•making it more difficult for us to make payments on our indebtedness;
•increasing our vulnerability to general economic and industry conditions;
•restricting us from making strategic acquisitions or causing us to make non-strategic divestitures;
•subjecting us to restrictive covenants that may limit our flexibility in operating our business;
•limiting our ability to obtain additional financing for working capital, capital expenditures, product development, debt service requirements, acquisitions, and general corporate or other purposes; and
•placing us at a competitive disadvantage compared to our competitors who are less highly leveraged.
Despite our significant leverage, we may be able to incur significant additional amounts of debt, which could further exacerbate the risks associated with our significant leverage.
Changes in interest rates may adversely affect our earnings and/or cash flows.
Our term loan and revolving line of credit bear interest at variable interest rates that use the London Inter-Bank Offered Rate (“LIBOR”) as a benchmark rate. The United Kingdom’s Financial Conduct Authority and the administrator of LIBOR have announced that the publication of the most commonly used U.S. dollar LIBOR setting will cease to be published or cease to be representative after June 30, 2023 and the publication of all other LIBOR settings will cease to be published as of December 31, 2021. Starting January 1, 2022, banks in the United States have ceased entering into new credit and other contractual agreements using U.S. dollar LIBOR as a reference rate, and instead began incorporating alternative reference rates such as the Secured Overnight Financing Rate (“SOFR”), within such agreements. SOFR is observed and backward-looking, which stands in contrast with LIBOR under the current methodology, which is an estimated forward-looking rate and relies, to some degree, on the expert judgment of submitting panel members. Given that SOFR is a secured rate backed by government securities, it will be a rate that does not take into account bank credit risk (as is the case with LIBOR). Although our credit agreement provides for successor base rates, the successor base rates may be related to LIBOR, and the consequences of any potential cessation, modification or other reform of LIBOR cannot be predicted at this time. We work to reduce our exposure to LIBOR through swap contracts which effectively fix a portion of our variable-rate interest payments. Our interest expense may increase, and our financial condition and operating results may be adversely affected.
We may be unable to obtain additional financing to fund our operations and growth.
We may require additional financing to fund our operations or growth. The failure to secure additional financing could have a material adverse effect on our continued development or growth. None of our officers, directors or stockholders are required to provide any financing to us.
Our only significant asset is our ownership interest in our operating subsidiaries and such ownership may not be sufficient to pay dividends or make distributions or loans to enable us to pay any dividends on our common stock or satisfy our other financial obligations, including our obligations under the tax receivable agreement.
We have no direct operations and no significant assets other than our ownership interest in our operating subsidiaries. We depend on our operating subsidiaries for distributions, loans and other payments to generate the funds necessary to meet our financial obligations, including our expenses as a publicly traded company, to pay any dividends with respect to our common stock, and to satisfy our obligations under the tax receivable agreement. See Note 9. Tax Receivable Agreement to the consolidated financial statements in Part II, Item 8 of this Annual Report on Form 10-K, for information on the tax receivable agreement. The financial condition and operating requirements of our operating subsidiaries may limit our ability to obtain cash from our operating subsidiaries. The earnings from, or other available assets of, our operating subsidiaries may not be sufficient to pay dividends or make distributions or loans to enable us to pay any dividends on our common stock or satisfy our other financial obligations, including our obligations under the tax receivable agreement.
The ability of our operating subsidiaries (other than subsidiaries which have been designated as unrestricted pursuant to our ability to do so in certain limited circumstances) to make distributions, loans and other payments to us for the purposes described above and for any other purpose are governed by the terms of our credit facilities and will be subject to the negative covenants set forth therein. Any loans or other extensions of credit will be subject to the investment covenants contained therein, which provide for several exceptions including, among others (i) a general investment basket equal to the greater of a fixed dollar amount and a percentage of EBITDA and (ii) an unlimited investment basket based on satisfying a total net leverage ratio on a pro forma basis. Similarly, any dividends, distributions or similar payments will be subject to the dividends and distributions covenant under such credit facilities, which also provide for several exceptions including, among others (i) for payment of overhead and certain fees and expenses of parent companies, (ii) for tax distributions, subject to certain limitations, (iii) a general dividend and distribution basket equal to the greater of a fixed dollar amount and a percentage of EBITDA and (iv) an unlimited dividend and distribution basket based on satisfying a total net leverage ratio on a pro forma basis.
RISKS RELATED TO OUR CLASS A COMMON STOCK
Our stock price may be volatile.
The market price of our Class A common stock could be subject to wide fluctuations in response to various factors, many of which are beyond our control. Purchases or sales of large quantities of our stock, or significant short positions in our stock could have an unusual or adverse effect on our market price. These fluctuations may also cause short sellers to periodically enter the market in the belief that we will have poor results in the future. Abnormal trading activity, including activity that is considered market manipulation, can lead to irrational and/or temporary movements in the price of our Class A common stock, which, in turn, may increase its risk and volatility. We cannot predict the actions of market participants and, therefore, can offer no assurances that the market for our Class A common stock will be stable or appreciate over time.
Anti-takeover provisions contained in our certificate of incorporation and bylaws, as well as provisions of Delaware law, could impair a takeover attempt.
Our certificate of incorporation contains provisions that may discourage unsolicited takeover proposals that stockholders may consider to be in their best interests. We are also subject to anti-takeover provisions under Delaware law, which could delay or prevent a change of control. Together, these provisions may make the removal of management more difficult and may discourage transactions that otherwise could involve payment of a premium over prevailing market prices for our securities. These provisions include:
•no cumulative voting in the election of directors, which limits the ability of minority stockholders to elect director candidates;
•the right of our board to elect a director to fill a vacancy created by the expansion of our board or the resignation, death or removal of a director in certain circumstances, which prevents stockholders from being able to fill vacancies on our board;
•a prohibition on stockholder action by written consent, which forces stockholder action to be taken at an annual or special meeting of our stockholders;
•a prohibition on stockholders calling a special meeting and the requirement that a meeting of stockholders may only be called by members of our board, which may delay the ability of our stockholders to force consideration of a proposal or to take action, including the removal of directors; and
•advance notice procedures that stockholders must comply with in order to nominate candidates to our board or to propose matters to be acted upon at a meeting of stockholders, which may discourage or deter a potential acquirer from conducting a solicitation of proxies to elect the acquirer’s own slate of directors or otherwise attempting to obtain control of us.
RISKS RELATED TO THE AMENDMENT OF PREVIOUSLY ISSUED REPORTS
The restatement of certain of our financial statements may subject us to risks and uncertainties, including the increased possibility of legal proceedings.
On April 30, 2021, management and the audit committee of our Board of Directors determined that our previously issued quarterly and year-to-date unaudited consolidated financial statements for March 31, 2020, June 30, 2020, September 30, 2020, December 31, 2020 and our audited consolidated financial statements for the years ending December 31, 2020, 2019 and 2018 should no longer be relied upon. In addition, we determined that the related press releases, earnings releases, and investor communications describing our financial statements for these periods should no longer be relied upon. The errors identified were non-cash and related to our classification of certain outstanding warrants. Accordingly, we restated the annual, quarterly and year-to-date audited and unaudited consolidated financial statements for the foregoing periods on May 17, 2021.
As a result of our restatement, we may become subject to additional risks and uncertainties, including, among others, the increased possibility of legal proceedings or a review by the SEC and other regulatory bodies. The costs of defending against such legal proceedings or administrative actions could be significant. In addition, we could face monetary judgments, penalties or other sanctions that could have a material adverse effect on our business, financial condition and operating results.
Item 1B. Unresolved Staff Comments
None.
Item 2. Properties
As of December 31, 2021, we operated the following facilities, supporting our Snacking reportable segment’s operations, as shown in the chart below.
| | | | | | | | | | | |
| Type | Location | Owned/Leased | Size (Sq. Ft.) |
| Bakery | Emporia, Kansas | Owned | 278,500 | |
| Bakery | Columbus, Georgia | Leased(1) | 313,700 | |
| Bakery | Indianapolis, Indiana | Owned | 195,000 | |
| Bakery | Chicago, Illinois | Owned | 137,000 | |
| Bakery and Distribution Center | Burlington, Ontario | Leased | 250,000 | |
| Distribution Center | Chicago, Illinois | Leased | 64,816 | |
| Distribution Center | Edgerton, Kansas | Leased | 765,000 | |
| Distribution Center | Emporia, Kansas | Leased | 24,112 | |
| Office Space | Chicago, Illinois | Leased | 9,325 | |
| Office Space | Nashville, Tennessee | Leased | 1,860 | |
| Office Space | Burlington, Ontario | Leased | 12,647 | |
| Corporate Headquarters | Lenexa, Kansas | Owned | 50,200 | |
| Third-Party Warehouse | Kansas City, Kansas | Other(2) | — | |
| Third-Party Warehouse | Carthage, Missouri | Other(2) | — | |
| Third-Party Warehouse | Hobart, Indiana | Other(2) | — | |
| Third-Party Warehouse | Belvidere, Illinois | Other(2) | — | |
| Third-Party Warehouse | Atlanta, Georgia | Other(2) | — | |
| Third-Party Warehouse | Fogelsville, Pennsylvania | Other(2) | — | |
(1) The Columbus, Georgia bakery is available to the Company for the purchase amount of $100.
(2) Variable usage fees are charged on a per-pallet basis.
Item 3. Legal Proceedings
We are involved in lawsuits, claims and proceedings arising in the ordinary course of business. These matters may involve personnel and employment issues, personal injury, contracts and other proceedings arising in the ordinary course of business. Although we do not expect the outcome of these proceedings to have a material adverse effect on our financial condition or results of operations, litigation is inherently unpredictable. Therefore, we could incur judgments or enter into settlements or claims that could materially impact our results.
The information required to be furnished by us under this Part I, Item 3 (Legal Proceedings) is incorporated by reference to the information contained in Note 15. Commitments and Contingencies to the consolidated financial statements included in Part II, Item 8 on this Annual Report on Form 10-K.
Item 4. Mine Safety Disclosures
Not applicable.
PART II
Item 5. Market for Registrant’s Common Equity, Related Stockholder Matters and Issuer Purchases of Equity Securities
Our Class A common stock is currently quoted on Nasdaq under the symbol “TWNK”.
As of February 21, 2022, there were 4 stockholders of record of our Class A common stock and no stockholders of record of our Class B common stock. Our Board of Directors periodically reviews our capital return policy to determine whether the payment of cash dividends or repurchases of securities are in the best interests of the Company and our stockholders.
We currently do not pay dividends and have not paid any cash dividends on our common stock to date.
Securities Authorized for Issuance Under Equity Compensation Plans | | | | | | | | | | | | | | | | | | | | | | | |
| Plan Category | | (A) Number of Securities to be Issued Upon Exercise of Outstanding Options, Warrants and Rights | | (B) Weighted Average Exercise Price of Outstanding Options, Warrants, and Rights | | (C) Number of Securities Remaining Available for Future Issuance Under Equity Compensation Plan (excluding securities reflected in column (A)) | |
| Equity Compensation Plans approved by stockholders | | 2,741,480 | | (1) | $ | 13.26 | | (2) | | 2,128,990 | | (3) |
| Equity Compensation Plans not approved by stockholders | | — | | | — | | — | | |
| Total | | 2,741,480 | | | $ | 13.26 | | | 2,128,990 | | |
(1)Consists of shares subject to outstanding stock options, restricted stock units and performance restricted stock units under the Hostess Brands, Inc. 2016 Equity Incentive Plan (the “2016 Plan”), some of which are vested and some of which remain subject to the vesting and/or performance criteria relating to the respective equity award.
(2)Represents the weighted average exercise price of 1,461,885 stock options and excludes the impact of 1,279,595 shares of restricted stock units for which no exercise price is payable.
(3)Consists of shares available for future issuance under the 2016 Plan.
For additional information, refer to Item 11 of Part III of this Annual Report on Form 10-K.
Issuer Purchase of Equity Securities | | | | | | | | | | | | | | | | | | | | | | | | | | |
| Period | | Total number of securities repurchased | | Average price paid per share | | Total number of securities purchased as part of publicly announced plans or programs | | Approximate dollar value of securities that may yet be purchased under the program (in millions) (1) |
| October 1 - 31, 2021 | | — | | | $ | — | | | — | | | $ | 42.0 | |
| November 1 - 30, 2021 | | — | | | — | | | — | | | 42.0 | |
| December 1 - 31, 2021 (2) | | 162,495 | | | 19.11 | | | 162,495 | | | 38.9 | |
| | 162,495 | | | | | 162,495 | | | |
(1)In November 2020, the Company’s Board of Directors approved a securities repurchase program of up to $100 million of its outstanding securities. As of December 31, 2021, there was $38.9 million remaining under this program. The program has no expiration date. The program may be amended, suspended or discontinued at any time at the Company’s discretion and does not commit the Company to repurchase its securities.
(2)Repurchase of shares of Class A common stock
Warrants
In July 2021, the agreement governing the Company’s public and private placement warrants was amended. Subsequent to the amendment, the exercise price for all outstanding warrants was payable through a “cashless exercise” with a premium of $0.25 added to the valuation price of each share for purposes of calculating the number of shares issuable upon exercise of the warrants. During the year ended December 31, 2021, 51,595,844 warrants were exercised on a cashless basis, resulting in the issuance of 9,822,909 shares of the Company’s Class A common stock, under the terms of the amended warrant agreement. All remaining warrants expired on November 4, 2021, with 1,120,714 warrants expiring unexercised.
As of December 31, 2021, there were no public or private placement warrants outstanding.
Performance Graph
The following graph and related information shall not be deemed “soliciting material” or be deemed to be “filed” with the Commission, nor shall such information be incorporated by reference into any future filing, except to the extent that we specifically incorporate it by reference into such filing. The following stock performance graph compares, for the period December 31, 2016 through December 31, 2021 (the last trading day of our fiscal year), the cumulative total stockholder return for (1) the Company’s common stock, (2) the S&P SmallCap 600 and (3) the S&P composite 1500 Packaged Foods and Meats Sub-Index. The graph assumes the value of the investment in our common stock and each index was $100.00 on December 31, 2016 and assumes reinvestment of any dividends. The stock price performance below is not necessarily indicative of future stock price performance.
Item 6. [RESERVED]
Item 7. Management’s Discussion and Analysis of Financial Condition and Results of Operations
The following discussion and analysis of our financial condition and results of operations should be read in conjunction with our consolidated financial statements and related notes included in Item 8 of this Annual Report on Form 10-K. This discussion contains forward-looking statements that involve risks and uncertainties. Our actual results could differ materially from those discussed below. Factors that could cause or contribute to such differences include, but are not limited to, those identified below and those discussed in Item 1A “Risk Factors” of this Annual Report on Form 10-K.
Overview
We are a leading sweet snacks company focused on developing, manufacturing, marketing, selling and distributing snack products in North America, providing a wide range of snack cakes, donuts, sweet rolls, breakfast pastries, cookies, snack pies and related products. As of December 31, 2021, we operate five baking facilities and utilize distribution centers and third-party warehouses to distribute our products. Our Direct-to-Warehouse product distribution system allows us to deliver to our customers’ warehouses. Our customers in turn distribute to their retail stores and/or distributors.
The Company has one reportable segment: Snacking. The Snacking segment consists of sweet baked goods, cookies, bread and buns that are sold under the Hostess®, Voortman®, Dolly Madison®, Cloverhill® and Big Texas® brands.
Hostess® is the second leading brand by market share within the Sweet Baked Goods (“SBG”) category, according to Nielsen U.S. total universe. For the 52-week period ended January 1, 2022 our branded SBG products’ (which include Hostess®, Dolly Madison®, Cloverhill®, and Big Texas®) market share was 21.3% per Nielsen’s U.S. SBG category data. Our Voortman® branded products include the #1 creme wafer and sugar-free cookie products within the larger Cookie category.
Principal Components of Operating Results
Net Revenue
We generate revenue through selling packaged snacks which include iconic products such as Donettes®, Twinkies®, CupCakes, Ding Dongs®, Zingers®, Danishes, Honey Buns and Coffee Cakes under the Hostess® group of brands, as well as cookies, wafers and sugar-free products under the Voortman® brand. We also sell products under the Dolly Madison®, Cloverhill® and Big Texas® brands along with private label products. Our product assortment is sold to customers’ warehouses and distribution centers by the case or in display-ready corrugate units. Retailers display and sell our products to the end consumer in single-serve, multi-pack or club-pack formats. We sell our products primarily to supermarket chains, national mass retailers and convenience and drug stores, along with a smaller portion of our product sales going to club stores, dollar stores, vending, and other retail outlets.
Our revenues are driven by average net price and total volume of products sold. Factors that impact unit pricing and sales volume include product mix, the cost of ingredients, promotional activities, industry capacity, new product initiatives and quality and consumer preferences. We do not keep a significant backlog of finished goods inventory, as our baked products are promptly shipped to our distribution centers after being produced and then distributed to customers.
Cost of Goods Sold
Cost of goods sold consists of ingredients, packaging, labor, energy, other production costs and warehousing and transportation costs including in-bound freight, inter-plant transportation and distribution of our products to customers. The cost of ingredients and packaging represent the majority of our total costs of goods sold. All costs that are incurred at the bakeries, including the depreciation of bakery facilities and equipment, are included in cost of goods sold. We do not allocate any corporate functions into cost of goods sold.
Our cost of ingredients consists principally of cooking oil, sugar, coatings and flour, which are subject to substantial price fluctuations, as is the cost of paper, corrugate, films and plastics used to package our products. The prices for raw materials are influenced by a number of factors, including the weather, crop production, transportation and processing costs, government regulation and policies and worldwide market supply and demand. We also rely on fuel products, such as natural gas, diesel, propane and electricity, to operate our bakeries and produce our products. Fluctuations in the prices of the raw materials or fuel products used in the production, packaging or transportation of our products affect the cost of products sold and our product pricing strategy. We utilize forward buying strategies through short-term and long-term advance purchase contracts to lock in prices for certain high-volume raw materials, packaged components and certain fuel inputs. Through these initiatives, we believe we are able to obtain competitive pricing.
Advertising and Marketing
Our advertising and marketing expenses include wire racks and corrugate displays delivered to customers to display our products off shelf, field marketing and merchandising services to reset and check our store inventory on a regular basis. We also invest in advertising campaigns, which include social media, print, online advertising, local promotional events, monthly agency fees and payroll costs.
Selling
Selling expenses primarily include sales management, sales employee related expenses, travel, and related expenses, as well as broker fees. We utilize brokers for sales support, including managing promotional activities and order processing.
General and Administrative
General and administrative expenses primarily include employee and related expenses for the accounting, finance, customer service, legal, human resources, corporate operations, research and development, purchasing, logistics and executive functions. Also included are professional service fees related to audit and tax, legal, outsourced information technology functions, transportation planning, headquarters and other office sites and insurance costs, as well as the depreciation and amortization of corporate assets.
Other Expenses
Other expenses primarily include interest paid on our term loan as well as the change in fair value of our liability-classified public and private placement warrants.
Non-Controlling Interest
During the year ended December 31, 2020, Mr. Metropoulos and the Metropoulos Entities held equity investment in us primarily through Class B limited partnership units in the Company’s subsidiary, Hostess Holdings (“Class B Units”), and an equal number of shares of the Company’s Class B common stock (“Class B Stock”). Our Class B Stock had voting, but no economic rights, while Hostess Holdings’ Class B Units had economic, but no voting rights. Each Class B Unit, together with a share of Class B Stock held by the Metropoulos Entities, was exchangeable for a share of the Company’s Class A common stock (or at the option of the Company, the cash equivalent thereof). The Company held 100% of the general partnership interest in Hostess Holdings. Subsequent to final exchange described below, the partnership was dissolved. The interest of the Metropoulos Entities in Hostess Holdings’ Class B Units prior to the final exchange is reflected in our consolidated financial statements as a non-controlling interest. The Metropoulos Entities have eliminated their ownership through a series of exchanges of shares of Class B Stock and Class B Units for an equal number of Class A shares. As part of the final exchange, we repurchased 0.4 million shares of Class A common stock from the Metropoulos Entities. The remaining shares were purchased by third parties. At December 31, 2020, there were no outstanding shares of Class B common stock.
Factors Impacting Recent Results
COVID-19
The acute and far-reaching impact of the COVID-19 pandemic and actions taken by governments to contain the spread of the virus have impacted our operations. During the first two quarters of 2020, as consumers prepared for extended stays at home, we experienced an increase in consumption, particularly in our multi-pack products sold through grocery and mass retailer channels. Conversely, during that same time frame, we experienced lower consumption of single-serve products, which are often consumed away from home. During the second half of 2020 and all of 2021, we have continued to experience strong demand in our multi-pack products, as well as an increase in our immediate consumption single-serve business as mobility increased. However, we cannot predict if these trends will sustain or reverse in future periods.
Since the start of the pandemic, our internal COVID-19 task force has monitored the rapidly evolving situation and implemented risk mitigation actions as deemed necessary. To date, we have not experienced significant disruptions to our supply chain and distribution network. However, it is possible that significant disruptions could still occur. Supply chain constraints seen elsewhere in the global economy due to availability of labor, transportation and raw materials could impact our ability to source ingredients and packaging for our bakeries or our ability to ship products to our customers. We continue to work closely with all of our vendors, distributors, contract manufacturers, and other external business partners to ensure availability of our products for our customers and consumers.
To protect our employees and ensure continuity of operations, we have implemented additional safety and sanitation measures in all of our facilities. We continue to follow protocols that are consistent with, or ahead of applicable local, state and federal guidelines. As many of our non-production team members, including sales, marketing and corporate employees, return to the office after working remotely for many months, we continue to monitor employee health and safety and adhere to evolving CDC guidelines while supporting our ability to bring products to consumers.
Despite the distribution of COVID-19 vaccines, uncertainty continues to exist regarding the pandemic and its impact on our business, including uncertainty related to, among other things, the duration of the pandemic, vaccine deployment and acceptance, new variants of COVID-19 and vaccine effectiveness for new variants, and the effect of actions to contain COVID-19 or treat its effect.
Under the provisions of the Coronavirus Aid, Relief, and Economic Security (“CARES”) Act, we were able to defer the payment of $5.6 million of 2020 employer payroll taxes. Payments of $2.8 million continue to be deferred as of December 31, 2021. Apart from this deferral and their impact on the general economy, including the labor market and consumer demand, neither the CARES Act, the American Rescue Plan enacted in the first quarter of 2021, nor any other government program intended to address COVID-19 had any material impact on our consolidated financial statements for the years ended December 31, 2021 or 2020. We continue to monitor any effects that may result from the CARES Act and other stimulus programs.
Acquisition
On January 3, 2020, we completed the acquisition of all of the shares of the parent company of Voortman Cookies Limited (“Voortman”), a manufacturer of premium, branded wafers and cookies, including sugar-free products. By adding the Voortman® brand, we believe we have greater growth opportunities provided by a more diverse portfolio of brands and products. Our consolidated statements of operations include the operation of these assets from January 3, 2020 through December 31, 2021. In December 2020, we asserted claims for indemnification against the sellers under the terms of the Share Purchase Agreement pursuant to which we acquired Voortman for an aggregate of approximately $90 million Canadian Dollar (“CAD”) in damages arising out of alleged breaches by the sellers of certain representations, warranties and covenants contained in such agreement relating to periods prior to the closing of the acquisition. We have also submitted claims relating to these alleged breaches under the representation and warranty insurance policy we purchased in connection with the acquisition. Such insurance policy has a coverage limit of $42.5 million CAD. We have entered into an agreement with the sellers to toll the running of any applicable limitation period that may apply to our claim against them while we work through our claim with our insurers. Although we strongly believe that our claims are meritorious, no assurance can be given as to whether we will recover all, or any part, of the amounts for which we have made such claims. No gains or receivables have been recognized related to these claims as of December 31, 2021 or 2020.
Change in Fair Value of Warrant Liabilities
During the years ended December 31, 2021 and 2020, there were fluctuations in the market price of our publicly traded warrants. These fluctuations created significant gains and losses on the remeasurement of certain warrants which are recognized as liabilities measured at fair value on our consolidated balance sheets. These remeasurements are recognized as “change in fair value of warrant liabilities” within other expenses on our consolidated statements of operations.
Results of Operations
| | | | | | | | | | | | | | | |
| | | |
(In thousands, except per share data) | Year Ended December 31, 2021 | | Year Ended
December 31,
2020 | | | | |
| Net revenue | $ | 1,142,036 | | | $ | 1,016,609 | | | | | |
| | | | | | | |
| | | | | | | |
| Gross profit | 409,983 | | | 355,639 | | | | | |
| As a % of net revenue | 35.9 | % | | 35.0 | % | | | | |
| | | | | | | |
| | | | | | | |
| | | | | | | |
| | | | | | | |
| | | | | | | |
| | | | | | | |
| | | | | | | |
| | | | | | | |
| | | | | | | |
| | | | | | | |
| | | | | | | |
| | | | | | | |
| Total operating costs and expenses | $ | 209,245 | | | $ | 220,329 | | | | | |
| Operating income | 200,738 | | | 135,310 | | | | | |
| | | | | | | |
| | | | | | | |
| | | | | | | |
| | | | | | | |
| | | | | | | |
| Total other expense | 40,926 | | | 6,608 | | | | | |
| | | | | | | |
| Income tax expense | 40,513 | | | 20,405 | | | | | |
| Net income | 119,299 | | | 108,297 | | | | | |
| | | | | | | |
| Net income attributable to Class A stockholders | $ | 119,299 | | | $ | 104,676 | | | | | |
| | | | | | | |
| Earnings per Class A share: | | | | | | | |
| Basic | $ | 0.91 | | | $ | 0.84 | | | | | |
| Diluted | 0.86 | | | 0.51 | | | | | |
| | | | | | | |
Results for the Year Ended December 31, 2021 Compared to Results for the Year Ended December 31, 2020
Net Revenue
Net revenue for the year ended December 31, 2021 increased $125.4 million, or 12.3%, compared to the year ended December 31, 2020 with higher volumes accounting for approximately seven percentage points of the annual growth. Sweet baked goods revenue increased $105.1 million or 11.4% due to higher volume in Convenience, Grocery and Dollar channels, the benefit of pricing actions implemented in the second half of the year and continued momentum of single-serve products driving favorable product mix. Cookies net revenue increased $20.3 million or 21.1% due to distribution growth and lapping the initial Voortman slotting fees paid in 2020 to obtain space in customer warehouses.
Gross Profit
Gross profit was 35.9% of net revenue for the year ended December 31, 2021, an increase of 92 basis points from a gross margin of 35.0% for the year ended December 31, 2020. The increase in gross profit was driven primarily by higher volume, productivity initiatives, pricing actions, and favorable product mix, as well as lapping Voortman acquisition and facility transition costs and COVID-19 costs in the prior year. These benefits were partially offset by transportation and input cost inflation.
Operating Costs and Expenses
Operating costs and expenses for the year ended December 31, 2021 decreased by 5.0% from the year ended December 31, 2020. These costs decreased primarily due to lapping Voortman acquisition and integration costs and conversion of Voortman’s operations. Operating costs in 2020 also reflect an impairment expense related to the planned disposition of production equipment, resulting in a decrease in 2021. These decreases were partially offset by increased headcount, higher incentive compensation, additional investment in marketing spend and increased project consulting costs.
Operating Income
Operating income for the year ended December 31, 2021 was $200.7 million compared to $135.3 million for the year ended December 31, 2020. The increase in gross profit gains and lapping the Voortman acquisition and integration costs incurred in the prior year contributed to the higher operating income in the current year.
Other Expense
For the years ended December 31, 2021 and 2020, interest expense related to our term loan was $38.6 million and $41.8 million, respectively. Also during the years ended December 31, 2021 and 2020 we recognized a $0.6 million gain and a $39.9 million gain, respectively, on the fair value remeasurement of our liability-classified public and private placement warrants. During the year ended December 31, 2021 we also recognized an unrealized gain of $0.5 million compared to a loss of $1.8 million during the year ended December 31, 2020 related to the remeasurement of certain CAD denominated liabilities.
Income Taxes
Our effective tax rate was 25.4% for the year ended December 31, 2021 compared to 15.9% for the year ended December 31, 2020. The effective tax rates in both periods were impacted by non-taxable mark-to-market adjustments on our liability-classified warrants. Additionally, the effective tax rate for the year ended December 31, 2021 reflects a tax benefit related to revaluing our deferred tax liabilities due to a change in the estimated state tax rate, while the effective tax rate for the year ended December 31, 2020 reflects a portion of income which was allocated to the non-controlling interest, a pass-through entity for tax purposes.
Net Income
For the year ended December 31, 2021, net income was $119.3 million compared to $108.3 million for the year ended December 31, 2020. Excluding the $0.6 million gain and $39.9 million gain on remeasurement of warrant liabilities for the years ended December 31, 2021 and 2020, respectively, net income increased as a result of higher gross profits, lower operating costs and lower interest expense.
Earnings Per Share
Our earnings per Class A share was $0.91 (basic) and $0.86 (dilutive) for the year ended December 31, 2021, compared to $0.84 (basic) and $0.51 (dilutive) for the year ended December 31, 2020. The increase in basic and diluted earnings per share was due to the net income impacts noted above.
RECONCILIATION OF NON-GAAP FINANCIAL MEASURES
Adjusted net revenue, adjusted gross profit, adjusted gross margin, adjusted operating income, adjusted net income, adjusted net income margin, adjusted Class A net income, adjusted EBITDA, adjusted EBITDA margin, and adjusted EPS collectively referred to as “Non-GAAP Financial Measures,” are commonly used in our industry and should not be construed as an alternative to net revenue, gross profit, gross margin operating income, net income, net income margin, net income attributed to Class A stockholders or earnings per share as indicators of operating performance (as determined in accordance with GAAP). These Non-GAAP Financial Measures may not be comparable to similarly titled measures reported by other companies. We included these Non-GAAP Financial Measures because we believe the measures provide management and investors with additional information to measure the Company’s performance, estimate the Company’s value and evaluate the Company’s ability to service debt.
Non-GAAP Financial Measures are adjusted to exclude certain items that affect comparability. The adjustments are itemized in the tables below. You are encouraged to evaluate these adjustments and the reason we consider them appropriate for supplemental analysis. In evaluating adjustments, you should be aware that in the future the Company may incur expenses that are the same as or similar to some of the adjustments set forth below. The presentation of Non-GAAP Financial Measures should not be construed as an inference that future results will be unaffected by unusual or recurring items.
For example, we define adjusted EBITDA as net income adjusted to exclude (i) interest expense, net, (ii) depreciation and amortization (iii) income taxes and (iv) share-based compensation, as further adjusted to eliminate the impact of certain items that the Company does not consider indicative of its ongoing operating performance. Adjusted EBITDA has limitations as an analytical tool, and you should not consider it in isolation, or as a substitute for analysis of the Company's results as reported under GAAP. For example, adjusted EBITDA:
•does not reflect the Company’s capital expenditures, future requirements for capital expenditures or contractual commitments;
•does not reflect changes in, or cash requirements for, the Company’s working capital needs;
•does not reflect the significant interest expense, or the cash requirements necessary to service interest or principal payments, on the Company’s debt; and
•does not reflect payments related to income taxes, the tax receivable agreement or distributions to the non-controlling interest to reimburse its tax liability.
| | | | | | | | | | | | | | | | | | | | | | | | | | | | | | | | | | | | | | | | |
| | | Year Ended December 31, 2021 |
| ($ and shares in thousands) | | | Gross
Profit | | Gross Margin | | Operating Income | | Net
Income | | Net Income Margin | | | | | Diluted
EPS |
| GAAP results | | | $ | 409,983 | | | 35.9 | % | | $ | 200,738 | | | $ | 119,299 | | | 10.4 | % | | | | | $ | 0.86 | |
| Non-GAAP adjustments: | | | | | | | | | | | | | | | | |
| Foreign currency remeasurement | | | — | | | — | | | — | | | (505) | | | — | | | | | | — | |
| Project consulting costs (1) | | | — | | | — | | | 6,081 | | | 6,081 | | | 0.5 | | | | | | 0.04 | |
| Change in fair value of warrant liabilities | | | — | | | — | | | — | | | (566) | | | — | | | | | | — | |
| | | | | | | | | | | | | | | | |
| | | | | | | | | | | | | | | | |
| | | | | | | | | | | | | | | | |
| | | | | | | | | | | | | | | | |
| Tax receivable agreement remeasurement | | | — | | | — | | | (1,409) | | | (1,409) | | | (0.1) | | | | | | (0.01) | |
| Other (2) | | | 704 | | | 0.1 | | | 2,107 | | | 4,338 | | | 0.4 | | | | | | 0.03 | |
| Remeasurement of tax liabilities | | | — | | | — | | | — | | | (3,357) | | | (0.3) | | | | | | (0.03) | |
| Tax impact of adjustments | | | — | | | — | | | — | | | (1,871) | | | (0.2) | | | | | | (0.01) | |
| | | | | | | | | | | | | | | | |
| Adjusted Non-GAAP results | | | $ | 410,687 | | | 36.0 | % | | $ | 207,517 | | | 122,010 | | | 10.7 | | | | | | $ | 0.88 | |
| | | | | | | | | | | | | | | | |
| Income tax | | | | | | | | | 45,741 | | | 4.0 | | | | | | |
| Interest expense | | | | | | | | | 39,762 | | | 3.5 | | | | | | |
| Depreciation and amortization | | | | | | | | | 51,681 | | | 4.5 | | | | | | |
| Share-based compensation | | | | | | | | | 9,585 | | | 0.8 | | | | | | |
| Adjusted EBITDA | | | | | | | | | $ | 268,779 | | | 23.5 | % | | | | | |
(1) Project consulting costs are included within general and administrative on the consolidated statement of operations.
(2) Costs related to certain corporate initiatives, including $2.8 million of Voortman acquisition related costs. Of the total $4.3 million, $0.7 million is included in cost of goods sold, $1.4 million is included in general and administrative and $2.2 million is included in other non-operating expenses.
| | | | | | | | | | | | | | | | | | | | | | | | | | | | | | | | | | | | | | | | | | | | | | | | | |
| Year Ended December 31, 2020 |
| ($ and shares in thousands) | Net Revenue | | Gross
Profit | | Gross Margin | | Operating Income | | Net
Income | | Net Income Margin | | Class A Net Income | | | | Diluted
EPS |
| GAAP results | $ | 1,016,609 | | | $ | 355,639 | | | 35.0 | % | | $135,310 | | $108,297 | | 10.7% | | $104,676 | | | | $0.51 |
| Non-GAAP adjustments: | | | | | | | | | | | | | | | | | |
| Foreign currency remeasurement | — | | | — | | | — | | — | | | 2,065 | | | 0.2 | | 1,966 | | | | | 0.02 | |
| Acquisition, disposal and integration related costs (1) | 6,821 | | | 7,963 | | | 0.5 | | 29,166 | | | 29,166 | | | 2.7 | | 27,569 | | | | | 0.22 | |
| Facility transition costs (2) | — | | | 3,681 | | | 0.4 | | 5,710 | | | 5,710 | | | 0.6 | | 5,396 | | | | | 0.04 | |
| Impairment of property and equipment | — | | | — | | | — | | 3,009 | | | 3,009 | | | 0.3 | | 2,909 | | | | | 0.02 | |
| Tax receivable agreement remeasurement | — | | | — | | | — | | 760 | | | 760 | | | 0.1 | | 760 | | | | | — | |
| COVID-19 costs (3) | — | | | 2,082 | | | 0.2 | | 2,388 | | | 2,388 | | | 0.2 | | 2,257 | | | | | 0.02 | |
| Change in fair value of warrant liabilities | — | | | — | | | — | | — | | | (39,941) | | | (3.9) | | (39,941) | | | | | — | |
| Other | — | | | — | | | — | | 100 | | | 1,766 | | | 0.2 | | 1,681 | | | | | 0.01 | |
| Remeasurement of tax liabilities | — | | | — | | | — | | — | | | (455) | | | (0.1) | | (455) | | | | | — | |
| Tax impact of adjustments | — | | | — | | | — | | — | | | (10,961) | | | (1.1) | | (10,961) | | | | | (0.09) | |
| | | | | | | | | | | | | | | | | |
| Adjusted Non-GAAP results | $ | 1,023,430 | | | $ | 369,365 | | | 36.1 | % | | $ | 176,443 | | | 101,804 | | | 9.9 | | | $ | 95,857 | | | | | $ | 0.75 | |
| | | | | | | | | | | | | | | | | |
| Income tax | | | | | | | | | 31,821 | | | 3.1 | | | | | | |
| Interest expense | | | | | | | | | 42,826 | | | 4.2 | | | | | | |
| Depreciation and amortization | | | | | | | | | 54,940 | | | 5.4 | | | | | | |
| Share-based compensation | | | | | | | | | 8,671 | | | 0.9 | | | | | | |
| Adjusted EBITDA | | | | | | | | | $ | 240,062 | | | 23.5 | % | | | | | | |
(1) Adjustments to net revenue represent initial slotting fees paid to customers to obtain space in customer warehouses for the Voortman transition. Adjustments to operating costs included $8.0 million of selling expense, $8.9 million of general and administrative expenses and $4.3 million of business combination transaction costs on the consolidated statement of operations.
(2) Facility transition costs are included in general and administrative expenses on the consolidated statement of operations.
(3) COVID-19 costs are included in cost of goods sold and general and administrative expenses on the consolidated statement of operations. Total COVID-19 non-GAAP adjustments primarily consist of costs of incremental cleaning and sanitation, personal protective equipment and employee bonuses in the first half of 2020.
Adjusted Net Revenue
There were no adjustments to net revenue for the year ended December 31, 2021. Net revenue increased $118.6 million, or 11.6%, compared to adjusted net revenue for the year ended December 31, 2020, with higher volumes accounting for approximately seven percentage points of the annual growth. Sweet baked goods net revenue increased $105.1 million or 11.4% due to higher volume in Convenience, Grocery and Dollar channels, the benefit of pricing actions implemented in the second half of the year and continued momentum of single-serve products driving favorable product mix. Cookies adjusted net revenue increased $13.5 million or 13.1% due to strong distribution growth in 2021, including introduction to the Convenience channel and pricing actions.
Adjusted Gross Margin
Adjusted gross margin was 36.0% for the year ended December 31, 2021, a decrease of 13 basis points from an adjusted gross margin of 36.1% for the year ended December 31, 2020. Adjusted gross margin was relatively flat in comparison to the prior year as transportation and input cost inflation was offset by productivity initiatives, pricing actions and favorable product mix.
Adjusted EBITDA
Adjusted EBITDA was $268.8 million for the year ended December 31, 2021, compared to $240.1 million for the year ended December 31, 2020. The improvement in adjusted EBITDA was driven by higher sales volume, productivity initiatives, pricing actions and the realization of Voortman cost synergies, partially offset by transportation and input cost inflation as well as increased headcount, higher incentive compensation and additional investment in marketing spend.
Adjusted EPS
Adjusted EPS was $0.88 for the year ended December 31, 2021, compared to $0.75 for the year ended December 31, 2020. The improvement in adjusted EPS was driven by strong adjusted EBITDA performance along with decreases in interest expense and depreciation and amortization, partially offset by the dilutive impact of settling the public and private warrants.
Liquidity and Capital Resources
Our primary sources of liquidity are from the cash and cash equivalents on the balance sheet, future cash flow generated from operations, and availability under our revolving credit agreement (“Revolver”). We believe that cash flows from operations and the current cash and cash equivalents on the balance sheet will be sufficient to satisfy the anticipated cash requirements associated with our existing operations for at least the next 12 months. Our future cash requirements include the purchase commitments for certain raw materials and packaging used in our production process, scheduled rent on leased facilities, scheduled debt service payments on our term loan and settlements on related interest rate swap contracts, payments on our tax receivable agreement, settlements on our outstanding foreign currency contracts and outstanding purchase orders on capital projects.
Our ability to generate sufficient cash from our operating activities depends on our future performance, which is subject to general economic, political, financial, competitive and other factors beyond our control. In addition, our future capital expenditures and other cash requirements could be higher than we currently expect as a result of various factors, including any expansion of our business that we undertake, including acquisitions. We consider all highly liquid investments purchased with an original maturity of three months or less to be cash equivalents.
We had working capital, excluding cash and warrant liabilities, as of December 31, 2021 and 2020 of $17.9 million and $7.0 million, respectively. We have the ability to borrow under our Revolver to meet obligations as they come due. As of December 31, 2021, we had approximately $94.0 million available for borrowing, net of letters of credit, under our Revolver.
Cash Flows from Operating Activities
Cash flows provided by operating activities for the years ended December 31, 2021 and 2020 were $203.0 million and $159.2 million, respectively. The increase in operating cash flows was driven by an increase in net income after adjusting for non-cash items such as change in fair value of warrant liabilities, depreciation and amortization, share-based compensation and impairment and loss on sale of assets.
Cash Flows provided by and used in Investing Activities
Investing activities used $65.4 million and $374.3 million of cash for the years ended December 31, 2021 and 2020, respectively. During 2020, we funded $316.0 million of the net cash required to purchase Voortman from cash on hand and the proceeds from an incremental term loan on our existing credit facility. Cash used for the purchase of property and equipment reflects planned investments in our bakeries, including new production lines.
Cash Flows provided by and used in Financing Activities
Financing activities used $61.3 million of cash for the year ended December 31, 2021 and provided $103.2 million of cash for the year ended December 31, 2020. The net outflow for 2021 consisted of cash used to repurchase 3.3 million shares of our common stock under our existing securities repurchase authorization offset by cash inflows from the proceeds on exercise of employee stock options and proceeds from the exercise of public warrants prior to the amendment of the warrant agreement in July 2021. The net inflow in 2020 reflects proceeds from debt originated to fund the purchase of Voortman, offset by cash outflows related to the repurchase of 2.0 million warrants and 0.4 million shares from the Metropoulos Entities as part of the exchange of their last remaining Class B units in Hostess Holdings, LP and distributions to non-controlling interest, which was dissolved in Q4 2020. Both periods reflected similar activity on cash outflows related to scheduled payments under the tax receivable agreement and term loan.
Long-Term Debt
As of December 31, 2021, $1,091.6 million aggregate principal amount of our term loan and $6.0 million aggregate principal amount of letters of credit, reducing the amount available under the Revolver, were outstanding. See Note 15. Commitments and Contingencies to the consolidated financial statements in Part II, Item 8 of this Annual Report on Form 10-K for information regarding the letters of credit. We had no outstanding borrowings under our Revolver as of December 31, 2021. As of December 31, 2021, we were in compliance with all covenants under our term loan and the Revolver. The Revolver contains certain restrictive financial covenants. Based on our current and projected financial performance, we believe that we will comply with these covenants for the foreseeable future.
Critical Accounting Estimates
The preparation of financial statements in accordance with generally accepted accounting principles in the United States requires the use of judgment, estimates and assumptions. We make such subjective determinations after careful consideration of our historical performance, management’s experience, current economic trends and events and information from outside sources. Inherent in this process is the possibility that actual results could differ from these estimates and assumptions for any particular period.
Our significant accounting policies are detailed in Note 1. Summary of Significant Accounting Policies of the notes to our consolidated financial statements within Item 8. Critical accounting policies are defined as those policies that are reflective of significant judgments, estimates and uncertainties, which could potentially result in materially different results under different assumptions and conditions. The following is a summary of certain accounting estimates considered critical by management.
Trade and Consumer Promotion Programs
We offer various sales incentive programs to customers, such as feature price discounts, in-store display incentives, cooperative advertising programs and new product introduction fees. The mix between promotional programs, which are classified as reductions in revenue in the statements of operations, and advertising or other marketing activities, which are classified as marketing and selling expenses in the consolidated statements of operations, fluctuates between periods based on our overall marketing plans, and such fluctuations have an impact on revenues. These trade programs also require management to make estimates about the expected total cost of the programs and related allocations amongst participants (who might have different levels of incentives based on various program requirements). These estimates are inherently uncertain and are generally based on historical experience, adjusted for any new facts or circumstances that might impact the ultimate cost estimate for a particular program or programs.
Goodwill and Indefinite-lived Trade Names
When evaluating goodwill and indefinite-lived intangible assets for impairment under U.S. GAAP, we may first perform an assessment of qualitative factors to determine if the fair value of the reporting unit or the intangible asset is more likely than not greater than the carrying amount. Such qualitative factors include, but are not limited to, macro-economic conditions, market and industry conditions, cost considerations, competitive environment, share price fluctuations, overall financial performance and results of past impairment tests. Based on a review of the qualitative factors, if we determine it is not more likely than not that the fair value is less than the carrying value, we may bypass the quantitative impairment test. We also may elect not to perform the qualitative assessment for the reporting unit and perform a quantitative impairment test. For our 2021 and 2020 annual impairment testing, we elected to perform qualitative assessments for our reporting unit. No indicators of impairment were noted.
If a quantitative test were to be utilized for our reporting unit, it would estimate the fair value of the reporting unit and compare it to its carrying value. To the extent the fair value was in excess of the carrying value, no impairment would be recognized. Otherwise, an impairment loss would be recognized for the amount that the carrying value of our reporting unit, including goodwill, exceeded its fair value. In performing the quantitative test of goodwill, fair value would be determined based on a calculation which would give consideration to an income approach utilizing the discounted cash flow method and the market approach using the market comparable and market transaction methods.
Our indefinite-lived intangible assets consist of trademarks and trade names. The $1,538.6 million balances at both December 31, 2021 and 2020, were recognized as part of the Hostess Business Combination and the Voortman and Cloverhill acquisitions. The trademarks and trade names are integral to the Company’s identity and are expected to contribute indefinitely to our corporate cash flows. Fair value for trademarks and trade names was determined using the income approach. The application of the income approach was premised on a royalty savings method, whereby the trademark and trade names are valued by reference to the amount of royalty income they could generate if they were licensed, in an arm’s-length transaction, to a third party. These assets have been assigned an indefinite life and therefore are not amortized but rather evaluated for impairment annually using the qualitative or quantitative methods similar to goodwill. For 2021 and 2020, we performed a qualitative test. No indicators of impairment were noted.
Changes in certain significant assumptions could have a significant impact on the estimated fair value, and therefore, a future impairment could result for a portion of goodwill or long-lived intangible assets.
Long-lived Assets
We review long-lived assets, including property and equipment and amortizable identifiable intangible assets (e.g. customer relationships), to assess recoverability from projected undiscounted cash flows whenever events or changes in facts and circumstances indicate that the carrying value of the assets may not be recoverable. When such events occur, we compare the sum of the undiscounted cash flows expected to result from the use and eventual disposition of the asset or asset group to the carrying amount of the long-lived asset or asset group. The cash flows are based on our best estimate of future cash flows derived from the most recent business projections. If this comparison indicates there is an impairment, the carrying value of the asset is reduced to its estimated fair value. We also evaluate the amortization periods assigned to our intangible assets to determine whether events or changes in circumstances require a revised estimate of useful lives. We recorded impairment charges of $2.9 million for the year ended December 31, 2020. There were no impairment losses for the year ended December 31, 2021.
Business Combinations
We account for business acquisitions using the purchase method of accounting. Assets acquired, liabilities assumed, and non-controlling interests are recorded at their estimated fair values at the acquisition date. The excess of purchase price over fair value of the net assets acquired, including the amount assigned to identifiable intangible assets, is recorded as goodwill. Given the time it takes to obtain pertinent information to finalize the acquired company’s balance sheet, it may be multiple quarters before we are able to finalize those initial fair value estimates. Accordingly, it is not uncommon for the initial estimates to be subsequently revised.
New Accounting Pronouncements
Refer to Note 1. Summary of Significant Accounting Policies of the notes to the consolidated financial statements included in Part II, Item 8 of this Annual Report on Form 10-K for further information regarding recently issued accounting standards.
Item 7A. Quantitative and Qualitative Disclosures about Market Risk
We are exposed to market risks related to interest rates and foreign currency exchange rates.
Market risk on variable-rate financial instruments
Our term loan and Revolver each bear interest on outstanding borrowings thereunder at variable interest rates. The rate in effect at December 31, 2021 for the outstanding term loan was a LIBOR-based rate of 3% per annum. At December 31, 2021, we had an aggregate principal balance of $1,091.6 million outstanding under the term loan and $94.0 million available for borrowing, net of letters of credit of $6.0 million, under the Revolver. Increases in market interest rates would cause interest expense to increase and earnings before income taxes to decrease.
To manage the risk related to our variable rate debt, we have entered into interest rate swap contracts with counter parties to make payments based on fixed interest rates ranging from 1.11% to 1.78% and receive payments based on the greater of LIBOR or 0.75%. At December 31, 2021, a notional amount of $600.0 million remained outstanding on the swap contracts. This notional amount will decrease $100.0 million in 2022, with the remaining notional amount of $500.0 million outstanding through the maturity of our term loan in August 2025.
The change in interest expense and earnings before income taxes resulting from a change in market interest rates would be dependent upon the weighted average outstanding borrowings and the portion of those borrowings that are hedged by our swap contract during the reporting period. An increase in applicable interest rates of 1% would result in an increase in interest expense of approximately $11.0 million and $11.1 million for the years ended December 31, 2021 and 2020, respectively, or approximately $4.6 million and $4.3 million after accounting for the impact of our swap contracts for the years ended December 31, 2021 and 2020, respectively.
Foreign Currency Risk
We are exposed to fluctuations of the Canadian Dollar (“CAD”) relative to the U.S. Dollar (“USD”) due to the operations of our Burlington, Ontario bakery and distribution center and sales to customers denominated in CAD. Revenue generated from Canadian customers, offset by the related selling expense and the operations of this facility, including certain raw materials, production labor and overhead, creates a net exposure to CAD denominated expenses. We enter into contracts to purchase Canadian dollars at fixed exchange rates throughout the year. At December 31, 2021 and 2020, we had contracts to purchase a total of $15.5 million and $14.6 million Canadian dollars at fixed exchange rates and varying dates from January 2022 through December 2022 and January 2021 through December 2021, respectively. At December 31, 2021 and 2020, a 10% change in the USD to CAD exchange rate would change the aggregate fair value of these contracts by approximately $0.9 million and $1.0 million for the years ended December 31, 2021 and 2020.
Item 8. Financial Statements and Supplementary Data
| | | | | |
| INDEX TO CONSOLIDATED FINANCIAL STATEMENTS |
| Audited Consolidated Financial Statements | |
| Report of Independent Registered Public Accounting Firm | |
Consolidated Balance Sheets as of December 31, 2021 and 2020 | |
Consolidated Statements of Operations for the years ended December 31, 2021, 2020 and 2019 | |
Consolidated Statements of Comprehensive Income for the years ended December 31, 2021, 2020 and 2019 | |
Consolidated Statements of Stockholders’ Equity for the years ended December 31, 2021, 2020 and 2019 | |
Consolidated Statements of Cash Flows for the years ended December 31, 2021, 2020 and 2019 | |
| Notes to Consolidated Financial Statements | |
Report of Independent Registered Public Accounting Firm
To the Stockholders and Board of Directors
Hostess Brands, Inc.:
Opinions on the Consolidated Financial Statements and Internal Control Over Financial Reporting
We have audited the accompanying consolidated balance sheets of Hostess Brands, Inc. and subsidiaries (the Company) as of December 31, 2021 and 2020, the related consolidated statements of operations, comprehensive income, stockholders’ equity, and cash flows for each of the years in the three-year period ended December 31, 2021, and the related notes (collectively, the consolidated financial statements). We also have audited the Company’s internal control over financial reporting as of December 31, 2021, based on criteria established in Internal Control – Integrated Framework (2013) issued by the Committee of Sponsoring Organizations of the Treadway Commission.
In our opinion, the consolidated financial statements referred to above present fairly, in all material respects, the financial position of the Company as of December 31, 2021 and 2020, and the results of its operations and its cash flows for each of the years in the three-year period ended December 31, 2021, in conformity with U.S. generally accepted accounting principles. Also in our opinion, the Company maintained, in all material respects, effective internal control over financial reporting as of December 31, 2021 based on criteria established in Internal Control – Integrated Framework (2013) issued by the Committee of Sponsoring Organizations of the Treadway Commission.
Basis for Opinions
The Company’s management is responsible for these consolidated financial statements, for maintaining effective internal control over financial reporting, and for its assessment of the effectiveness of internal control over financial reporting, included in the accompanying Management’s Report on Internal Control Over Financial Reporting. Our responsibility is to express an opinion on the Company’s consolidated financial statements and an opinion on the Company’s internal control over financial reporting based on our audits. We are a public accounting firm registered with the Public Company Accounting Oversight Board (United States) (PCAOB) and are required to be independent with respect to the Company in accordance with the U.S. federal securities laws and the applicable rules and regulations of the Securities and Exchange Commission and the PCAOB.
We conducted our audits in accordance with the standards of the PCAOB. Those standards require that we plan and perform the audits to obtain reasonable assurance about whether the consolidated financial statements are free of material misstatement, whether due to error or fraud, and whether effective internal control over financial reporting was maintained in all material respects.
Our audits of the consolidated financial statements included performing procedures to assess the risks of material misstatement of the consolidated financial statements, whether due to error or fraud, and performing procedures that respond to those risks. Such procedures included examining, on a test basis, evidence regarding the amounts and disclosures in the consolidated financial statements. Our audits also included evaluating the accounting principles used and significant estimates made by management, as well as evaluating the overall presentation of the consolidated financial statements. Our audit of internal control over financial reporting included obtaining an understanding of internal control over financial reporting, assessing the risk that a material weakness exists, and testing and evaluating the design and operating effectiveness of internal control based on the assessed risk. Our audits also included performing such other procedures as we considered necessary in the circumstances. We believe that our audits provide a reasonable basis for our opinions.
Definition and Limitations of Internal Control Over Financial Reporting
A company’s internal control over financial reporting is a process designed to provide reasonable assurance regarding the reliability of financial reporting and the preparation of financial statements for external purposes in accordance with generally accepted accounting principles. A company’s internal control over financial reporting includes those policies and procedures that (1) pertain to the maintenance of records that, in reasonable detail, accurately and fairly reflect the transactions and dispositions of the assets of the company; (2) provide reasonable assurance that transactions are recorded as necessary to permit preparation of financial statements in accordance with generally accepted accounting principles, and that receipts and expenditures of the company are being made only in accordance with authorizations of management and directors of the company; and (3) provide reasonable assurance regarding prevention or timely detection of unauthorized acquisition, use, or disposition of the company’s assets that could have a material effect on the financial statements.
Because of its inherent limitations, internal control over financial reporting may not prevent or detect misstatements. Also, projections of any evaluation of effectiveness to future periods are subject to the risk that controls may become inadequate because of changes in conditions, or that the degree of compliance with the policies or procedures may deteriorate.
Critical Audit Matter
The critical audit matter communicated below is a matter arising from the current period audit of the consolidated financial statements that was communicated or required to be communicated to the audit committee and that: (1) relates to accounts or disclosures that are material to the consolidated financial statements and (2) involved our especially challenging, subjective, or complex judgments. The communication of a critical audit matter does not alter in any way our opinion on the consolidated financial statements, taken as a whole, and we are not, by communicating the critical audit matter below, providing a separate opinion on the critical audit matter or on the accounts or disclosures to which it relates.
Evaluation of customer trade allowances
As discussed in Note 1 to the consolidated financial statements, the Company has recorded a provision for customer trade allowances, consisting primarily of pricing allowances and merchandising programs associated with sales to customers. The liability recorded for the estimated cost of these programs is dependent on factors such as the ultimate purchase volume activity, participation levels of customers, and the related settlement rates for these programs. The Company’s liability for customer trade allowances as of December 31, 2021 was $52.7 million.
We identified the evaluation of the customer trade allowance as a critical audit matter because of the higher degree of auditor judgment required to evaluate the Company’s estimates. This is due to uncertainty around the amount of settlements, which typically occur in a period subsequent to the related sales transactions, and in particular, the estimate of purchase volumes made by retailers from distributors.
The following are the primary procedures we performed to address this critical audit matter. We evaluated the design and tested the operating effectiveness of certain internal controls related to the Company’s trade process at disaggregated levels. This included controls related to the Company’s trade spend trending and lookback analyses based on final settlement. We analyzed the liability by trade allowance type to identify unusual trends. We assessed the Company’s historical ability to accurately estimate its customer trade allowances by comparing historical estimates to final settlements. We compared a sample of settlements subsequent to period end to the amount previously recognized by the Company.
/s/ KPMG LLP
We have served as the Company’s auditor since 2013.
Kansas City, Missouri
March 1, 2022
HOSTESS BRANDS, INC.
CONSOLIDATED BALANCE SHEETS
(Amounts in thousands, except shares)
| | | | | | | | | | | | | | |
| December 31, | | | December 31, |
| ASSETS | 2021 | | | 2020 |
| Current assets: | | | | |
| Cash and cash equivalents | $ | 249,159 | | | | $ | 173,034 | |
| Accounts receivable, net | 148,180 | | | | 125,550 | |
| Inventories | 52,813 | | | | 49,348 | |
| Prepaids and other current assets | 10,564 | | | | 21,614 | |
| Total current assets | 460,716 | | | | 369,546 | |
| Property and equipment, net | 335,305 | | | | 303,959 | |
| Intangible assets, net | 1,944,392 | | | | 1,967,903 | |
| Goodwill | 706,615 | | | | 706,615 | |
| Other assets, net | 19,283 | | | | 17,446 | |
| Total assets | $ | 3,466,311 | | | | $ | 3,365,469 | |
| | | | |
| LIABILITIES AND STOCKHOLDERS’ EQUITY | | | | |
| Current liabilities: | | | | |
| Long-term debt and lease obligations payable within one year | $ | 14,170 | | | | $ | 13,811 | |
| Tax receivable agreement obligations payable within one year | 11,600 | | | | 11,800 | |
| Accounts payable | 68,104 | | | | 61,428 | |
| Customer trade allowances | 52,746 | | | | 46,779 | |
| Warrant liabilities | — | | | | 861 | |
| Accrued expenses and other current liabilities | 47,009 | | | | 55,715 | |
| Total current liabilities | 193,629 | | | | 190,394 | |
| Long-term debt and lease obligations | 1,099,975 | | | | 1,113,037 | |
| Tax receivable agreement obligations | 134,265 | | | | 144,744 | |
| Deferred tax liability | 317,847 | | | | 295,009 | |
| Other long-term liabilities | 1,605 | | | | 1,560 | |
| Total liabilities | 1,747,321 | | | | 1,744,744 | |
| Commitments and Contingencies (Note 15) | | | | |
Class A common stock, $0.0001 par value, 200,000,000 shares authorized, 142,031,329 shares issued and 138,278,573 shares outstanding as of December 31, 2021 and 130,791,908 shares issued and 130,347,464 shares outstanding as of December 31, 2020 | 14 | | | | 13 | |
| | | | |
| Additional paid in capital | 1,303,254 | | | | 1,281,018 | |
| Accumulated other comprehensive loss | (506) | | | | (10,407) | |
| Retained earnings | 475,400 | | | | 356,101 | |
| Treasury stock | (59,172) | | | | (6,000) | |
| Stockholders’ equity | 1,718,990 | | | | 1,620,725 | |
| | | | |
| Total liabilities and stockholders’ equity | $ | 3,466,311 | | | | $ | 3,365,469 | |
See accompanying notes to the consolidated financial statements.
HOSTESS BRANDS, INC.
CONSOLIDATED STATEMENTS OF OPERATIONS
(Amounts in thousands, except shares and per share data) | | | | | | | | | | | | | | | | | | | | | | |
| Year Ended December 31, 2021 | | Year Ended
December 31,
2020 | | Year Ended
December 31,
2019 | | | | | |
| Net revenue | $ | 1,142,036 | | | $ | 1,016,609 | | | $ | 907,675 | | | | | | |
| Cost of goods sold | 732,053 | | | 660,970 | | | 607,841 | | | | | | |
| Gross profit | 409,983 | | | 355,639 | | | 299,834 | | | | | | |
| | | | | | | | | | |
| Operating costs and expenses: | | | | | | | | | | |
| Advertising and marketing | 51,683 | | | 45,724 | | | 39,775 | | | | | | |
| Selling | 36,288 | | | 46,729 | | | 30,719 | | | | | | |
| General and administrative | 99,173 | | | 92,860 | | | 69,423 | | | | | | |
| Amortization of customer relationships | 23,510 | | | 26,510 | | | 23,377 | | | | | | |
| Business combination transaction costs | — | | | 4,282 | | | 1,914 | | | | | | |
| Tax receivable agreement remeasurement | (1,409) | | | 760 | | | 186 | | | | | | |
| Gain on foreign currency contract | — | | | — | | | (7,128) | | | | | | |
| Other operating expense | — | | | 3,464 | | | 5,472 | | | | | | |
| Total operating costs and expenses | 209,245 | | | 220,329 | | | 163,738 | | | | | | |
| Operating income | 200,738 | | | 135,310 | | | 136,096 | | | | | | |
| Other (income) expense: | | | | | | | | | | |
| Interest expense, net | 39,762 | | | 42,826 | | | 39,870 | | | | | | |
| | | | | | | | | | |
| Change in fair value of warrant liabilities | (566) | | | (39,941) | | | 58,816 | | | | | | |
| Other expense | 1,730 | | | 3,723 | | | 1,769 | | | | | | |
| Total other expense | 40,926 | | | 6,608 | | | 100,455 | | | | | | |
| Income before income taxes | 159,812 | | | 128,702 | | | 35,641 | | | | | | |
| Income tax expense | 40,513 | | | 20,405 | | | 16,892 | | | | | | |
| Net income | 119,299 | | | 108,297 | | | 18,749 | | | | | | |
| Less: Net income attributable to the non-controlling interest | — | | | 3,621 | | | 14,450 | | | | | | |
| Net income attributable to Class A stockholders | $ | 119,299 | | | $ | 104,676 | | | $ | 4,299 | | | | | | |
| | | | | | | | | | |
| Earnings per Class A share: | | | | | | | | | | |
| Basic | $ | 0.91 | | | $ | 0.84 | | | $ | 0.04 | | | | | | |
| Diluted | $ | 0.86 | | | $ | 0.51 | | | $ | 0.04 | | | | | | |
| Weighted-average shares outstanding: | | | | | | | | | | |
| Basic | 131,571,733 | | | 124,927,535 | | | 110,540,264 | | | | | | |
| Diluted | 138,198,176 | | | 127,723,488 | | | 111,005,689 | | | | | | |
See accompanying notes to the consolidated financial statements.
HOSTESS BRANDS, INC.
CONSOLIDATED STATEMENTS OF COMPREHENSIVE INCOME
(Amounts in thousands)
| | | | | | | | | | | | | | | | | | | | | | |
| | | | | | |
| Year Ended
December 31,
2021 | | Year Ended
December 31,
2020 | | Year Ended
December 31,
2019 | | | | | |
| Net income | $ | 119,299 | | | $ | 108,297 | | | $ | 18,749 | | | | | | |
| Other comprehensive income: | | | | | | | | | | |
| Unrealized gain (loss) on interest rate swaps and foreign currency contracts designated as cash flow hedges | 8,973 | | | (16,870) | | | (4,063) | | | | | | |
| Reclassification into net income | 4,503 | | | 3,886 | | | (1,705) | | | | | | |
| Income tax benefit (expense) | (3,575) | | | 3,421 | | | 1,222 | | | | | | |
| Comprehensive income | 129,200 | | | 98,734 | | | 14,203 | | | | | | |
| Less: Comprehensive income attributed to non-controlling interest | — | | | 2,749 | | | 13,292 | | | | | | |
| Comprehensive income attributed to Class A stockholders | $ | 129,200 | | | $ | 95,985 | | | $ | 911 | | | | | | |
See accompanying notes to the consolidated financial statements.
HOSTESS BRANDS, INC.
CONSOLIDATED STATEMENTS OF STOCKHOLDERS’ EQUITY
(Amounts in thousands) | | | | | | | | | | | | | | | | | | | | | | | | | | | | | | | | | | | | | | | | | | | | | | | | | | | | | | | | | | | | | | | | | |
| Class A Voting
Common Stock | | Class B Voting
Common Stock | | Additional
Paid-in Capital | | Accumulated Other Comprehensive Income (Losses) | | Retained Earnings | | Treasury Stock | | Total
Stockholders’
Equity | | Non-controlling
Interest |
| Shares | | Amount | | Shares | | Amount | | | | | | | | Shares | | Amount | | | | |
| | | | | | | | | | | | | | | | | | | | | |
| | | | | | | | | | | | | | | | | | | | | |
| | | | | | | | | | | | | | | | | | | | | |
| | | | | | | | | | | | | | | | | | | | | |
| | | | | | | | | | | | | | | | | | | | | |
| | | | | | | | | | | | | | | | | | | | | |
| | | | | | | | | | | | | | | | | | | | | |
| | | | | | | | | | | | | | | | | | | | | |
| | | | | | | | | | | | | | | | | | | | | |
| | | | | | | | | | | | | | | | | | | | | |
| Balance–December 31, 2018 | 100,046 | | | $ | 10 | | | 30,256 | | | $ | 3 | | | $ | 897,652 | | | $ | 2,523 | | | $ | 247,126 | | | — | | | $ | — | | | $ | 1,147,314 | | | $ | 350,454 | |
| Comprehensive income | — | | | — | | | — | | | — | | | — | | | (3,388) | | | 4,299 | | | — | | | — | | | 911 | | | 13,292 | |
Share-based compensation, net of income taxes of $1,354 | 209 | | | — | | | — | | | — | | | 7,877 | | | — | | | — | | | — | | | — | | | 7,877 | | | — | |
| Exchanges | 21,845 | | | 2 | | | (21,845) | | | (2) | | | 262,547 | | | 109 | | | — | | | — | | | — | | | 262,656 | | | (262,656) | |
| Distributions | — | | | — | | | — | | | — | | | — | | | — | | | — | | | — | | | — | | | — | | | (6,658) | |
| Exercise of employee stock options | 7 | | | — | | | — | | | — | | | 23 | | | — | | | — | | | — | | | — | | | 23 | | | — | |
| Payment of taxes for employee stock awards | — | | | — | | | — | | | — | | | (1,431) | | | — | | | — | | | — | | | — | | | (1,431) | | | — | |
| | | | | | | | | | | | | | | | | | | | | |
Tax receivable agreement arising from exchanges, net of income taxes of $28,817 | — | | | — | | | — | | | — | | | (42,863) | | | — | | | — | | | — | | | — | | | (42,863) | | | — | |
| Balance–December 31, 2019 | 122,107 | | | 12 | | | 8,411 | | | 1 | | | 1,123,805 | | | (756) | | | 251,425 | | | — | | | — | | | 1,374,487 | | | 94,432 | |
| Comprehensive income | — | | | — | | | — | | | — | | | — | | | (8,691) | | | 104,676 | | | — | | | — | | | 95,985 | | | 2,749 | |
Share-based compensation, including income taxes of $2,167 | 223 | | | — | | | — | | | — | | | 10,838 | | | — | | | — | | | — | | | — | | | 10,838 | | | — | |
| Exchanges | 8,411 | | | 1 | | | (8,411) | | | (1) | | | 94,719 | | | (960) | | | — | | | — | | | — | | | 93,759 | | | (93,759) | |
| Distributions | — | | | — | | | — | | | — | | | — | | | — | | | — | | | — | | | — | | | — | | | (3,422) | |
| Exercise of employee stock options and warrants | 50 | | | — | | | — | | | — | | | 690 | | | — | | | — | | | — | | | — | | | 690 | | | — | |
| Payment of taxes for employee stock awards | — | | | — | | | — | | | — | | | (1,440) | | | — | | | — | | | — | | | — | | | (1,440) | | | — | |
| | | | | | | | | | | | | | | | | | | | | |
| Reclassification of public warrants | — | | | — | | | — | | | — | | | 68,503 | | | — | | | — | | | — | | | — | | | 68,503 | | | — | |
| | | | | | | | | | | | | | | | | | | | | |
| Repurchase of common stock | (444) | | | — | | | — | | | — | | | — | | | — | | | — | | | 444 | | | (6,000) | | | (6,000) | | | — | |
Tax receivable agreement arising from exchanges, net of income taxes of $11,818 | — | | | — | | | — | | | — | | | (16,097) | | | — | | | — | | | — | | | — | | | (16,097) | | | — | |
| Balance-December 31, 2020 | 130,347 | | | 13 | | | — | | | $ | — | | | 1,281,018 | | | (10,407) | | | 356,101 | | | 444 | | | (6,000) | | | 1,620,725 | | | — | |
| Comprehensive income (loss) | — | | | — | | | — | | | — | | | — | | | 9,901 | | | 119,299 | | | — | | | — | | | 129,200 | | | — | |
| Share-based compensation | 224 | | | — | | | — | | | — | | | 9,585 | | | — | | | — | | | — | | | — | | | 9,585 | | | — | |
| Exercise of employee stock options | 313 | | | — | | | — | | | — | | | 4,488 | | | — | | | — | | | — | | | — | | | 4,488 | | | — | |
| Exercise of public warrants | 881 | | | — | | | — | | | — | | | 9,632 | | | — | | | — | | | — | | | — | | | 9,632 | | | — | |
Cashless exercise of public warrants, net of fees of $500 | 9,823 | | | 1 | | | — | | | — | | | — | | | — | | | — | | | — | | | — | | | 1 | | | — | |
| Payment of taxes for employee stock awards | — | | | — | | | — | | | — | | | (1,767) | | | — | | | — | | | — | | | — | | | (1,767) | | | — | |
| Reclassification of warrants | — | | | — | | | — | | | — | | | 298 | | | — | | | — | | | — | | | — | | | 298 | | | — | |
| Repurchase of common stock | (3,309) | | | — | | | — | | | — | | | — | | | — | | | — | | | 3,309 | | | (53,172) | | | (53,172) | | | — | |
| Balance-December 31, 2021 | 138,279 | | | $ | 14 | | | — | | | $ | — | | | $ | 1,303,254 | | | $ | (506) | | | $ | 475,400 | | | 3,753 | | | $ | (59,172) | | | $ | 1,718,990 | | | $ | — | |
See accompanying notes to the consolidated financial statements.
HOSTESS BRANDS, INC.
CONSOLIDATED STATEMENTS OF CASH FLOWS
(Amounts in thousands) | | | | | | | | | | | | | | | | | | | | | | |
| Year Ended
December 31,
2021 | | Year Ended
December 31,
2020 | | Year Ended
December 31,
2019 | | | | | |
| Operating activities | | | | | | | | | | |
| Net income | $ | 119,299 | | | $ | 108,297 | | | $ | 18,749 | | | | | | |
| Depreciation and amortization | 51,681 | | | 54,940 | | | 43,334 | | | | | | |
| Impairment and loss on sale of assets | — | | | 3,329 | | | 1,976 | | | | | | |
| Non-cash loss on debt modification | — | | | — | | | 531 | | | | | | |
| Debt discount (premium) amortization | 1,238 | | | 1,289 | | | (747) | | | | | | |
| Tax receivable agreement remeasurement | (1,409) | | | 760 | | | 185 | | | | | | |
| Change in fair value of warrant liabilities | (566) | | | (39,941) | | | 58,816 | | | | | | |
| Non-cash fees on sale of business | — | | | — | | | 1,414 | | | | | | |
| Unrealized loss (gain) on foreign currency | (503) | | | 2,061 | | | (7,128) | | | | | | |
| Non-cash lease expense | 1,247 | | | 571 | | | — | | | | | | |
| Share-based compensation | 9,585 | | | 8,671 | | | 9,231 | | | | | | |
| | | | | | | | | | |
| Deferred taxes | 18,995 | | | 16,806 | | | 14,121 | | | | | | |
| Change in operating assets and liabilities, net of acquisitions and dispositions: | | | | | | | | | | |
| Accounts receivable | (22,728) | | | 4,434 | | | (2,570) | | | | | | |
| Inventories | (3,465) | | | 5,824 | | | (12,477) | | | | | | |
| Prepaids and other current assets | 9,876 | | | (5,301) | | | 265 | | | | | | |
| Accounts payable and accrued expenses | 13,723 | | | 1,900 | | | 14,072 | | | | | | |
| Customer trade allowances | 6,056 | | | (4,397) | | | 4,202 | | | | | | |
| | | | | | | | | | |
| Net cash provided by operating activities | 203,029 | | | 159,243 | | | 143,974 | | | | | | |
| | | | | | | | | | |
| Investing activities | | | | | | | | | | |
| Purchases of property and equipment | (60,803) | | | (51,983) | | | (34,875) | | | | | | |
| Acquisition of business, net of cash | — | | | (316,013) | | | — | | | | | | |
| Proceeds from sale of business, net of cash | — | | | — | | | 63,345 | | | | | | |
| | | | | | | | | | |
| Acquisition and development of software assets | (4,622) | | | (6,269) | | | (5,609) | | | | | | |
| Net cash provided by (used in) investing activities | (65,425) | | | (374,265) | | | 22,861 | | | | | | |
| Financing activities | | | | | | | | | | |
| Repayments of long-term debt and financing lease obligations | (11,167) | | | (11,168) | | | (9,894) | | | | | | |
| Proceeds from long-term debt origination, net of fees paid | — | | | 136,888 | | | — | | | | | | |
| Debt refinancing costs | — | | | — | | | (7,433) | | | | | | |
| Distributions to non-controlling interest | — | | | (3,422) | | | (6,658) | | | | | | |
| Repurchase of warrants | — | | | (2,000) | | | — | | | | | | |
| Repurchase of common stock | (53,172) | | | (6,000) | | | — | | | | | | |
| Payment of taxes related to the net issuance of employee stock awards | (1,767) | | | (1,440) | | | (1,431) | | | | | | |
| Payments on tax receivable agreement | (9,270) | | | (10,327) | | | (2,732) | | | | | | |
| Cash received from exercise of options and warrants, net of fees | 14,121 | | | 690 | | | 23 | | | | | | |
| Net cash provided by (used in) financing activities | (61,255) | | | 103,221 | | | (28,125) | | | | | | |
| Effect of exchange rate changes on cash and cash equivalents | (224) | | | (252) | | | — | | | | | | |
| Net increase (decrease) in cash and cash equivalents | 76,125 | | | (112,053) | | | 138,710 | | | | | | |
| Cash and cash equivalents at beginning of period | 173,034 | | | 285,087 | | | 146,377 | | | | | | |
| Cash and cash equivalents at end of period | $ | 249,159 | | | $ | 173,034 | | | $ | 285,087 | | | | | | |
| | | | | | | | | | |
| Supplemental Disclosures of Cash Flow Information | | | | | | | | | | |
| Interest paid | $ | 38,567 | | | $ | 41,776 | | | $ | 43,986 | | | | | | |
| Taxes paid | $ | 12,081 | | | $ | 5,825 | | | $ | 1,840 | | | | | | |
| Supplemental disclosure of non-cash investing | | | | | | | | | | |
| Accrued capital expenditures | $ | 2,244 | | | $ | 4,718 | | | $ | 2,910 | | | | | | |
See accompanying notes to the consolidated financial statements.
HOSTESS BRANDS, INC.
NOTES TO CONSOLIDATED FINANCIAL STATEMENTS
1. Summary of Significant Accounting Policies
Description of Business
Hostess Brands, Inc. is a Delaware corporation headquartered in Lenexa, Kansas. The consolidated financial statements include the accounts of Hostess Brands, Inc. and its subsidiaries (collectively, the “Company”). The Company is a leading sweet snacks company focused on developing, manufacturing, marketing, selling and distributing snacks in North America under the Hostess® and Voortman® brands. The Company produces a variety of new and classic treats including iconic Hostess® Donettes®, Twinkies®, CupCakes, Ding Dongs® and Zingers® as well as a variety of Voortman® cookies and wafers. The Hostess® brand dates back to 1919 when the Hostess® CupCake was introduced to the public, followed by Twinkies® in 1930.
Basis of Presentation
The Company’s operations are primarily conducted through its wholly-owned operating subsidiary, Hostess Brands, LLC (“HBLLC”) and its subsidiaries. Hostess Brands, Inc. is a holding company with no significant assets or operations other than cash and cash equivalents of $56.2 million and $40.4 million at December 31, 2021 and 2020, respectively, tax receivable agreement liability, investment in its subsidiaries and current and deferred income tax assets and liabilities related to its earnings from HBLLC. The consolidated financial statements included herein have been prepared in accordance with generally accepted accounting principles in the United States of America (“U.S. GAAP”) and the rules and regulations of the Securities and Exchange Commission (“SEC”). The accompanying consolidated financial statements include the accounts of the Company and its wholly-owned, majority-owned or controlled subsidiaries, collectively referred to as the Company. All intercompany balances and transactions have been eliminated in consolidation. Certain prior period amounts have been reclassified to conform with current period presentation.
The Company’s operating subsidiaries are wholly-owned by Hostess Holdings, a direct subsidiary of Hostess Brands, Inc. Prior to the final exchange of Class B stock (as described below), Hostess Brands, Inc. held 100% of the general partnership interest in Hostess Holdings and a majority of the limited partnership interests therein and consolidated Hostess Holdings in the Company’s consolidated financial statements. The remaining limited partnership interests in Hostess Holdings were held by the holders of Class B stock.
C. Dean Metropoulos and entities under his control (the “Metropoulos Entities”) held their equity investment in the Company primarily through Class B limited partnership units (“Class B Units”) in Hostess Holdings LP (“Hostess Holdings”) and an equal number of shares of the Company’s Class B common stock (“Class B Stock”). Each Class B Unit, together with a share of Class B Stock held by the Metropoulos Entities, was exchangeable for a share of the Company’s Class A common stock. The interest of the Class B Units was reflected in the consolidated financial statements as a non-controlling interest. During the year ended December 31, 2020, the Metropoulos Entities exchanged all of their remaining Class B Units and Class B Stock for Class A common stock. At December 31, 2021 and 2020, there were no outstanding Class B Units or Class B stock and there is no non-controlling interest reported on the December 31, 2021 or 2020 consolidated balance sheets.
Subsequent to the Metropoulos Entities’ final exchange of Class B Units, all subsidiaries, including Hostess Holdings are wholly owned by the Company.
Prior to the final exchange of Class B Units, the Company determined that Hostess Holdings, a limited partnership, was a variable interest entity (“VIE”) and that the Company was the primary beneficiary of the VIE. The Company determined that, due to its ownership of Hostess Holdings’ general partnership units, the Company had the power to direct all of the activities of Hostess Holdings, with no substantive kick-out rights or participating rights by the limited partners individually or as a group. Hostess Holdings constituted the majority of the assets of the Company.
The Company has one reportable segment: Snacking. For the year ended December 31, 2019, the Company had two reportable segments: Snacking and In-Store Bakery prior to the sale of its operations on August 30, 2019.
HOSTESS BRANDS, INC.
NOTES TO CONSOLIDATED FINANCIAL STATEMENTS
Principles of Consolidation
The accompanying consolidated financial statements include the accounts of the Company and its majority-owned or controlled subsidiaries (including those for which the Company was the primary beneficiary of a VIE), collectively referred to as the Company. All intercompany balances and transactions have been eliminated in consolidation.
Adoption of New Accounting Standards
On January 1, 2021, the Company adopted Accounting Standards Update (“ASU”), 2019-12 Income Taxes (Topic 740): Simplifying the Accounting for Income Taxes. This ASU simplifies the accounting for certain income tax related items, including intraperiod tax allocations, deferred taxes related to foreign subsidiaries and step-up in tax basis of goodwill. The adoption of this standard did not have a material impact on the consolidated financial statements.
On January 1, 2020, the Company adopted ASU No. 2016-13 Financial Instruments-Credit Losses (Topic 326): Measurement of Credit Losses on Financial Instruments. This ASU requires entities to measure the impairment of certain financial instruments, including trade receivables, based on expected losses rather than incurred losses. The adoption of this standard did not have a material impact on the consolidated financial statements.
Use of Estimates
The preparation of consolidated financial statements in conformity with U.S. GAAP requires management to make estimates and judgments that affect the reported amounts of assets and liabilities at the date of the financial statements and for the reported amounts of revenues and expenses during the reporting period. Management utilizes estimates, including, but not limited to, valuation and useful lives of tangible and intangible assets, future cash tax savings rate, incremental borrowing rate and the allocation of the liability between short-term and long-term based on when the Company realizes certain tax attributes and reserves for trade and promotional allowances. Actual results could differ from these estimates.
Cash and Cash Equivalents
The Company considers all highly liquid investments purchased with original maturities of three months or less when purchased as cash equivalents and records these at cost. Under the Company’s cash management system, checks that have been issued and are out of the control of the Company, but which have not cleared the bank by the balance sheet date, are reported as a reduction of cash.
Accounts Receivable
Accounts receivable represents amounts invoiced to customers for which the Company’s obligation to the customer has been satisfied. As of December 31, 2021 and 2020, the Company’s accounts receivable were $148.2 million and $125.6 million, respectively, which have been reduced by allowances for damages occurring during shipment, quality claims and doubtful accounts in the amount of $3.0 million and $3.5 million, respectively.
The allowance for doubtful accounts represents the Company’s estimate of expected credit losses related to trade receivables. To estimate the allowance for doubtful accounts, the Company leverages information on historical losses, current conditions, and reasonable and supportable forecasts of future conditions. Account balances are written off against the allowance when the Company deems the amount is uncollectible.
HOSTESS BRANDS, INC.
NOTES TO CONSOLIDATED FINANCIAL STATEMENTS
Inventories
Inventories are stated at the lower of cost or net realizable value on a first-in first-out basis. Abnormal amounts of idle facility expense, freight, handling costs, and wasted material (spoilage) are expensed in the period they are incurred.
The components of inventories are as follows:
| | | | | | | | | | | |
(In thousands) | December 31,
2021 | | December 31,
2020 |
| Ingredients and packaging | $ | 22,607 | | | $ | 22,965 | |
| Finished goods | 26,988 | | | 23,583 | |
| Inventory in transit to customers | 3,218 | | | 2,800 | |
| $ | 52,813 | | | $ | 49,348 | |
Property and Equipment
Additions to property and equipment are recorded at cost and depreciated straight-line over estimated useful lives of 15 to 50 years for buildings and land improvements and 3 to 20 years for machinery and equipment. In order to maximize the efficiency of the Company’s operations and to operate the acquired equipment, occasionally the Company will remove and relocate equipment between bakeries. Such removal and relocation costs are expensed as incurred. Reinstallation costs are capitalized if the useful life is extended or the equipment is significantly improved. Otherwise, reinstallation costs are expensed as incurred. Expenditures for repairs and maintenance are charged to expense when incurred. Expenditures for major renewals and betterments, which extend the useful lives of existing property and equipment, are capitalized and depreciated. Upon retirement or disposition of property and equipment, the capitalized cost and related accumulated depreciation are removed from the balance sheet and any resulting gain or loss is recognized in the consolidated statements of operations.
The Company assesses property, plant and equipment for impairment whenever events or changes in facts and circumstances indicate that the carrying amount of the asset may not be recoverable based on projected undiscounted cash flows. For the years ended December 31, 2020 and 2019, the Company recorded impairment losses of $2.9 million and $0.5 million, respectively, in the Snacking segment located within other operating expenses on the consolidated statements of operations. There were no impairment losses for the year ended December 31, 2021.
Software Costs
Costs associated with computer software projects during the preliminary project stage are expensed as incurred. Once management authorizes and commits to funding a project, appropriate application development stage costs are capitalized. Capitalization ceases when the project is substantially complete and the software is ready for its intended use. Upgrades and enhancements to software are capitalized when such enhancements are determined to provide additional functionality. Training and maintenance costs associated with software applications are expensed as incurred.
Capitalized software is included in other assets in the consolidated balance sheets in the amount of $14.7 million at both December 31, 2021 and 2020. Capitalized software costs are amortized over their estimated useful life of up to five years commencing when such assets are ready for their intended use. Software amortization expense included in general and administrative expense in the consolidated statements of operations was $4.7 million, $5.3 million and $2.7 million for the years ended December 31, 2021, 2020 and 2019, respectively.
Goodwill and Intangible Assets
For the years ended December 31, 2021 and 2020, the goodwill balance of $706.6 million represents the excess of the amount the Company paid for the acquisition of Hostess Holdings from the Metropoulos Entities and other former equity holders in a 2016 transaction and the acquisition of Voortman in 2020 over the fair values of the assets acquired and liabilities assumed. The resulting goodwill was allocated to the Snacking reportable segment.
Goodwill by reporting unit is tested for impairment annually by either performing a qualitative evaluation or a quantitative test. The qualitative evaluation is an assessment of factors to determine whether it is more likely than not that the fair value of a reporting unit is less than its carrying amount, including goodwill. The Company may
HOSTESS BRANDS, INC.
NOTES TO CONSOLIDATED FINANCIAL STATEMENTS
elect not to perform the qualitative assessment for some or all reporting units and perform a quantitative impairment test.
The Company’s indefinite-lived intangible assets consist of trademarks and trade names. The $1,538.6 million balance at both December 31, 2021 and 2020, was recognized as part of the 2016 acquisition of Hostess Holdings, the 2018 acquisition of the Cloverhill Business and the 2020 acquisition of Voortman. The trademarks and trade names are integral to the Company’s identity and are expected to contribute indefinitely to its corporate cash flows. Fair value for trademarks and trade names was determined using the income approach, which is considered to be Level 3 within the fair value hierarchy. The application of the income approach was premised on a royalty savings method, whereby the trademark and trade names are valued by reference to the amount of royalty income they could generate if they were licensed, in an arm’s-length transaction, to a third party. These assets have been assigned an indefinite life and therefore are not amortized but rather evaluated for impairment annually using the qualitative or quantitative methods, similar to goodwill. For the quantitative assessment, the valuation of trademarks and trade names are determined using the relief from royalty method. Significant assumptions used in this method include future trends in sales, a royalty rate and a discount rate to be applied to the forecasted revenue stream.
For the 2021 and 2020 annual impairment tests of goodwill and indefinite-lived intangible assets, the Company elected to perform the qualitative test. No indicators of impairment were noted. During the year ended December 31, 2019, the Company recognized an impairment charge of $1.0 million to the In-Store Bakery goodwill and intangibles. See Note 7. Goodwill and Intangible Assets for more information on impairment charges.
Also, the Company has finite-lived intangible assets, net of accumulated amortization, of $405.8 million and $429.3 million on December 31, 2021 and 2020 respectively, consisting of customer relationships that were recognized as part of the Hostess Holdings, Voortman and Cloverhill acquisitions. For customer relationships, the application of the income approach (Level 3) was premised on an excess earnings method, whereby the customer relationships are valued by the earnings expected to be generated from those customers after other capital charges. Finite-lived intangible assets are being amortized on a straight-line basis over the estimated remaining useful lives of the assets, from 3 to 18 years. The weighted-average amortization period as of December 31, 2021 for customer relationships was 17.7 years.
The Company assesses finite-lived intangible assets for impairment whenever events or changes in facts and circumstances indicate that the carrying amount of the asset may not be recoverable based on projected undiscounted cash flows, similar to property, plant and equipment. There were no impairment losses for the years ended December 31, 2021, 2020 and 2019.
Reserves for Self-Insurance Benefits
The Company’s employee health plan is self-insured up to a stop-loss amount of $0.3 million for each participant per plan year. In addition, the Company maintains insurance programs covering its exposure to workers’ compensation. Such programs include the retention of certain levels of risks and costs through high deductibles and other risk retention strategies. Included in the accrued expenses in the consolidated balance sheets is a reserve for healthcare claims in the amount of approximately $1.9 million and $2.2 million at December 31, 2021 and 2020, respectively, and a reserve for workers’ compensation claims of $3.1 million and $2.9 million at December 31, 2021 and 2020, respectively.
Leases
The Company recognizes a right of use asset and corresponding lease liability on the consolidated balance sheets for all lease transactions with terms of more than 12 months. Agreements are determined to contain a lease if they convey the use and control of an underlying physical asset. Based on the nature of the lease transaction, leases are either classified as financing or operating. Under both classifications, the right of use asset and liability are initially valued based on the present value of the future minimum lease payments using an effective borrowing rate at the inception of the lease. The Company determined the effective borrowing rate based on its expected incremental borrowing rate on collateralized debt. At December 31, 2021, 2020 and 2019, the weighted average effective borrowing rate for outstanding operating leases was 3.6%, 3.6% and 4.4%, respectively.
HOSTESS BRANDS, INC.
NOTES TO CONSOLIDATED FINANCIAL STATEMENTS
Under a financing lease, interest expense related to the lease liability is recognized over the lease term using an effective interest rate method and right of use assets are amortized straight-line over the term of the lease. Under an operating lease, minimum lease payments are expensed straight-line over the lease term. Lease liabilities are amortized using an effective interest rate method and right of use assets are reduced based on the excess of the sum of the straight-line lease expense and the reduction of the lease liability over the actual lease payments. At December 31, 2021, 2020 and 2019, the weighted average remaining terms on operating leases were approximately seven, eight and six years, respectively.
Variable lease payments, such as taxes and insurance, are expensed as incurred. Expenses related to leases with original terms less than 12 months (short-term leases) are expensed as incurred. For all leases related to distribution, bakery and corporate facilities, the Company has elected not to separate non-lease components from lease components.
At December 31, 2021, right of use assets related to operating leases are included in property and equipment, net on the consolidated balance sheets (see Note 5. Property and Equipment). Lease liabilities for operating leases are included in the current and non-current portions of long-term debt and lease obligations on the consolidated balance sheets (see Note 10. Debt).
Revenue Recognition
Net revenue consists primarily of sales of packaged food products. The Company recognizes revenue when the performance obligations under the terms of its agreements with customers have been satisfied. The Company’s obligation is satisfied when control of the product is transferred to its customers along with the title, risk of loss and rewards of ownership. Depending on the arrangement with the customer, these criteria are met either at the time the product is shipped or when the product is received by such customer.
Customers are invoiced at the time of shipment or customer pickup based on credit terms established in accordance with industry practice. Invoices generally require payment within 30 days. As a result, revenue is not adjusted for the effects of a significant financing component. Net revenue is recognized in an amount that reflects the consideration the Company expects to be entitled to in exchange for that product. Amounts billed to customers related to shipping and handling are classified as net revenue and accounted for as fulfillment activities, rather than separate performance obligations. The Company generally does not accept product returns and provides these allowances for anticipated expired or damaged products.
Trade promotions, consisting primarily of customer pricing allowances and merchandising funds are offered through various programs to customers. A provision for estimated trade promotions is recorded as a reduction of revenue in the same period when the sale is recognized, with the liability for these allowances included within customer trade allowances on the consolidated balance sheets. Differences between estimated and actual reductions to the transaction price are recognized as a change in estimate in a subsequent period.
The Company also offers rebates based on purchase levels, products carried in retail stores and customers’ promotional activity. The ultimate cost of these programs is dependent on various factors such as actual purchase volumes or promotional performance and is the subject of significant management estimates. Assumptions included in the development of these estimates are primarily based on historical performance adjusted for current trends. The Company regularly reviews these assumptions and related estimates. The Company accounts for these programs as variable consideration and recognizes a reduction in revenue in the same period as the underlying program. Our recorded liability for allowances is included within customer trade allowances on the consolidated balance sheets.
For product produced by third parties, management evaluates whether the Company is the principal (i.e., report revenue on a gross basis) or agent (i.e., report revenue on a net basis). Management has determined that it is the principal in all cases, since it establishes its own pricing for such product, assumes the credit risk for amounts billed to its customers, and often takes physical control of the product before it is shipped to customers.
HOSTESS BRANDS, INC.
NOTES TO CONSOLIDATED FINANCIAL STATEMENTS
The following tables disaggregate revenue by geographical market and category:
| | | | | | | | | | | | | | | | | | | |
| Year Ended December 31, 2021 |
| (In thousands) | Sweet Baked Goods | | | | Cookies | | Total |
| United States | $ | 1,025,541 | | | | | $ | 98,797 | | | $ | 1,124,338 | |
| Canada | — | | | | | 17,698 | | | 17,698 | |
| $ | 1,025,541 | | | | | $ | 116,495 | | | $ | 1,142,036 | |
| | | | | | | | | | | | | | | | | | | |
| Year Ended December 31, 2020 |
| (In thousands) | Sweet Baked Goods | | | | Cookies | | Total |
| United States | $ | 920,388 | | | | | $ | 77,692 | | | $ | 998,080 | |
| Canada | — | | | | | 18,529 | | | 18,529 | |
| $ | 920,388 | | | | | $ | 96,221 | | | $ | 1,016,609 | |
| | | | | | | | | | | | | | | | | | | |
| Year Ended December 31, 2019 |
| (In thousands) | Sweet Baked Goods | | In-Store Bakery | | | | Total |
| United States | $ | 878,973 | | | $ | 28,702 | | | | | $ | 907,675 | |
| Canada | — | | | — | | | | | — | |
| $ | 878,973 | | | $ | 28,702 | | | | | $ | 907,675 | |
The Company has one customer that accounted for 10% or more of the Company’s total net revenue. The percentage of total net revenues for this customer is presented below by segment:
| | | | | | | | | | | | | | | | | | | | | | |
| Year Ended
December 31,
2021 | | Year Ended
December 31,
2020 | | Year Ended
December 31,
2019 | | | | | |
| Snacking | 18.9 | % | | 20.2 | % | | 23.3 | % | | | | | |
| In-Store Bakery | — | % | | — | % | | 0.3 | % | | | | | |
| Total | 18.9 | % | | 20.2 | % | | 23.6 | % | | | | | |
HOSTESS BRANDS, INC.
NOTES TO CONSOLIDATED FINANCIAL STATEMENTS
Advertising Costs
Advertising costs are expensed as incurred. Advertising expense included in advertising and marketing in the consolidated statements of operations was $9.5 million, $6.2 million and $4.1 million for the years ended December 31, 2021, 2020 and 2019, respectively.
Foreign Currency Remeasurement
Certain Voortman sales and production related costs are denominated in the Canadian dollar (“CAD”). CAD transactions have been remeasured into U.S. dollars (“USD”) on the consolidated statements of operations using the average exchange rate for the reporting period. Balances expected to be settled in CAD have been remeasured into USD on the consolidated balance sheets using the exchange rate at the end of the period. During the year ended December 31, 2021 and 2020 the Company recognized a gain on remeasurement of $0.5 million and losses of $1.8 million, respectively, reported within other expense on the consolidated statements of operations.
Equity Compensation
The grant date fair values of stock options are valued using the Black-Scholes option-pricing model, including a simplified method to estimate the number of periods to exercise date (i.e., the expected option term). Management has determined that the equity plan has not been in place for a sufficient amount of time to estimate the post vesting exercise behavior. Therefore, it will continue to use this simplified method until such time as it has sufficient history to provide a reasonable basis to estimate the expected term. Forfeitures are recognized as a reduction of expense as incurred.
For awards which have market conditions, compensation expense is calculated based on the number of shares expected to vest after assessing the probability that the performance or market criteria will be met. For market-based awards, probability is not reassessed and compensation expense is not remeasured subsequent to the initial assessment on the grant date.
Shares issued for option exercises, restricted stock units and other stock-based awards may be either authorized but unissued shares or shares of treasury stock.
Collective Bargaining Agreements
As of December 31, 2021, approximately 44%, of the Company’s employees are covered by collective bargaining agreements. Two of these agreements expire before December 31, 2022.
Employee Benefit Plans
The Company provides several benefit plans for employees depending upon employee eligibility. The Company has a health care plan, a defined contribution retirement plan (401(k)), company-sponsored life insurance, and other benefit plans. For the defined contribution retirement plan, the Company matches a percentage of employee contributions up to a specified amount. For the years ended December 31, 2021, 2020 and 2019, contributions to the defined contribution retirement plan were $2.4 million, $2.0 million and $1.8 million, respectively.
The Company offers an annual incentive plan based upon annual operating targets. Final payout is approved by the Board of Directors or a committee thereof. As of December 31, 2021 and 2020 there was $21.2 million and $14.2 million accrued for this plan, respectively.
Income Taxes
The Company is subject to U.S. federal, state and local income taxes as well as Canadian income tax on certain subsidiaries.
Prior to the final exchange of Class B Units, the Company owned a controlling interest in Hostess Holdings, which was treated as a partnership for U.S. federal and most applicable state and local income tax purposes. As a partnership, Hostess Holdings was not directly subject to U.S. federal and certain state and local income taxes. Any taxable income or loss generated by Hostess Holdings was passed through to and included in the taxable income or loss of its partners, including the Company.
The Company accounts for income taxes under the asset and liability method. Under this method, deferred tax liabilities and assets are determined based on the difference between the financial statement and tax basis of assets and liabilities using enacted tax rates in effect for the year in which the difference is expected to reverse.
HOSTESS BRANDS, INC.
NOTES TO CONSOLIDATED FINANCIAL STATEMENTS
Additionally, the impact of changes in the enacted tax rates and laws on deferred taxes, if any, is reflected in the financial statements in the period of enactment.
The Company recognizes the effect of income tax positions only if those positions are more likely than not to be sustained. Recognized income tax positions are measured at the largest amount that is greater than 50% likely of being realized. Changes in recognition or measurement are reflected in the period in which the change in judgment occurs (see Note 14. Income Taxes).
Derivatives
At December 31, 2020 and 2019, the Company had outstanding public and private placement warrants which were originated in the 2015 initial public offering of a special purpose acquisition company (“SPAC”), which subsequently acquired Hostess Holdings in 2016 in a transaction that resulted in the Company becoming the parent company of Hostess Holdings. Due to certain provisions in the warrant agreement, the Company concluded that certain warrants do not meet the criteria to be classified in stockholders’ equity. In periods in which the public and private warrants meet the definition of a liability-classified derivative under Accounting Standards Codification (“ASC”) 815, the Company recognized these warrants within current liabilities on the consolidated balance sheets at fair value, with subsequent changes in fair value recognized in the consolidated statements of operations at each reporting date. The warrants expired on November 4, 2021 and are no longer outstanding.
The Company has entered into interest rate swap contracts to mitigate its exposure to changes in the variable interest rate on its long-term debt. The Company has also entered into Canadian Dollar (CAD) purchase contracts to mitigate its exposure to foreign currency exchange rates on its CAD denominated production costs. Both interest rate swap contracts and CAD purchase contracts are designated as cash flow hedges. Changes in the fair value of these instruments are recognized in accumulated other comprehensive income in the consolidated balance sheets and reclassified into earnings in the period in which the hedged transaction affects earnings. Hedging ineffectiveness, if any, is recognized as a component of interest expense for interest rate swap contracts and costs of goods sold for CAD purchase contracts in the consolidated statements of operations. Payments made under the interest rate swap contracts are included in the supplemental disclosure of interest paid in the consolidated statements of cash flows.
The Company also used a CAD purchase contract to mitigate the impact of foreign currency exchange rates on its January 2020 purchase of Voortman. This contract was settled during the year ended December 31, 2020 and did not qualify as a cash flow hedge.
See Note 11. Derivative Instruments for more information on our derivative instruments.
Fair Value Measurements
The Company utilizes valuation techniques that maximize the use of observable inputs and minimize the use of unobservable inputs to the best extent possible. The Company determines fair value based on assumptions that market participants would use in pricing an asset or liability in the principal or most advantageous market. When considering market participant assumptions in fair value measurements, the following fair value hierarchy distinguishes between observable and unobservable inputs, which are categorized in one of the following levels:
•Level 1 inputs: Unadjusted quoted prices in active markets for identical assets or liabilities accessible to the reporting entity at the measurement date.
•Level 2 inputs: Other than quoted prices included in Level 1 inputs that are observable for the asset or liability, either directly or indirectly, for substantially the full term of the asset or liability.
•Level 3 inputs: Unobservable inputs for the asset or liability used to measure fair value to the extent that observable inputs are not available, thereby allowing for situations in which there is little, if any, market activity for the asset or liability at measurement date.
HOSTESS BRANDS, INC.
NOTES TO CONSOLIDATED FINANCIAL STATEMENTS
New Accounting Pronouncements
In March 2020, the FASB issued ASU No. 2020-04, Reference Rate Reform (Topic 848): Facilitation of the Effects of Reference Rate Reform on Financial Reporting, which provides practical expedients and exceptions for applying GAAP to contracts, hedging relationships, and other transactions affected by reference rate reform if certain criteria are met. The expedients and exceptions provided by the amendments in this update apply only to contracts, hedging relationships, and other transactions that reference the London Inter-Bank Offered Rate (“LIBOR”) or another reference rate expected to be discontinued as a result of reference rate reform. These amendments are not applicable to contract modifications made and hedging relationships entered into or evaluated after December 31, 2022. ASU No. 2020-04 is effective as of March 12, 2020 through December 31, 2022 and may be applied to contract modifications and hedging relationships from the beginning of an interim period that includes or is subsequent to March 12, 2020. The Company is evaluating the impact the new standard will have on the consolidated financial statements and related disclosures but does not anticipate a material impact.
2. Business Combinations and Divestitures
Voortman Acquisition
On January 3, 2020, the Company completed the acquisition of all of the shares of the parent company of Voortman, a manufacturer of premium, branded wafers as well as sugar-free and specialty cookies for approximately $328.7 million ($427.0 million CAD), reflecting final working capital and other closing statement adjustments.
Net cash outflow related to the purchase price during the year ended December 31, 2020 was $316.0 million. This net cash outflow reflects a non-cash gain on a related foreign currency contract of $6.9 million, cash acquired of $1.6 million and an outstanding liability as of December 31, 2020 for certain purchase price adjustments of $4.2 million. As of December 31, 2021 the outstanding liability for certain purchase price adjustments was $4.3 million.
The acquisition of Voortman diversifies and expands the Company’s product offerings and manufacturing capabilities in the adjacent Cookie category. The acquisition also leverages the Company’s customer reach and lean and agile business model. The Company expects to realize additional benefits of scale via sharing established, efficient infrastructure and strengthening collaborative retail partnerships in the United States and Canada.
During the year ended December 31, 2020, working capital and other adjustments of $4.7 million were made to goodwill. Included in other non-current liabilities in the table below is a $1.3 million liability for pre-acquisition uncertain tax positions. The opening balance sheet was offset by a non-current receivable balance of $1.3 million representing expected recovery through indemnifications.
HOSTESS BRANDS, INC.
NOTES TO CONSOLIDATED FINANCIAL STATEMENTS
The following is a summary of the final purchase price allocation:
| | | | | |
| (In thousands) | |
| Cash | $ | 1,639 | |
| Accounts receivable | 24,848 | |
| Inventory | 7,564 | |
| Income tax receivable | 7,522 | |
| Other current assets | 420 | |
| Property and equipment | 32,028 | |
| Customer relationships (1) | 11,100 | |
| Trade names (2) | 130,000 | |
| Goodwill (3) | 170,762 | |
| Other non-current assets | 1,320 | |
| Accounts payable and accrued expenses | (6,172) | |
| Customer trade allowances | (5,428) | |
| Lease liabilities | (6,420) | |
| Deferred taxes | (39,149) | |
| Other non-current liabilities | (1,320) | |
| Assets acquired and liabilities assumed | $ | 328,714 | |
(1) Customer relationships were valued through application of the income approach (Level 3). Under this approach, revenue, operating expenses and other costs associated with existing customers were estimated in order to derive cash flows attributable to the existing customer relationships. The resulting cash flows were then discounted to present value to arrive at the fair value of existing customer relationships as of the valuation date. The estimated useful lives by operating segment ranging from one to eight years represent the approximate point in the projection period in which a majority of the assets’ cash flows are expected to be realized based on assumed attrition rates.
(2) The trade names were valued through application of the income approach (level 3), involving the estimation of likely future sales and an appropriate royalty rate. The trade name and trademarks are estimated to have indefinite useful lives as the Company expects a market participant would use the trade name and trademarks in perpetuity based on their historical strength and consumer recognition.
(3) Goodwill represents the excess of the consideration transferred over the fair values of the assets acquired and liabilities assumed. It is primarily attributable to synergies and intangible assets such as assembled workforce which are not separately recognizable.
During the years ended December 31, 2020 and 2019, the Company incurred $4.3 million and $1.9 million, respectively, of expenses related to this acquisition. These expenses are classified as business combination transaction costs on the consolidated statements of operations.
The following unaudited pro forma combined financial information presents the Company’s results as though the acquisition of Voortman had occurred at January 1, 2019. The unaudited pro forma consolidated financial information has been prepared using the acquisition method of accounting in accordance with U.S. GAAP:
| | | | | | | | | | | |
| Twelve Months Ended |
| (In thousands) | December 31,
2020 | | December 31,
2019 |
| (unaudited, pro forma) |
| Net revenue | $ | 1,016,609 | | | $ | 1,007,140 | |
| Net income | 108,297 | | | 11,612 | |
In-Store Bakery Divestiture
On August 30, 2019, the Company sold its In-Store Bakery operations, including relevant trademarks and licensing agreements, to an unrelated party. The operations included products that were primarily sold in the in-store bakery section of U.S. retail channels. The Company divested the operations to provide more focus on future investment in areas of its business that better leverage its core competencies.
HOSTESS BRANDS, INC.
NOTES TO CONSOLIDATED FINANCIAL STATEMENTS
The Company received proceeds from the divestiture of $65.0 million prior to transaction expenses and subject to certain post-closing adjustments. In connection with the sale, during the year ended December 31, 2019, the Company recognized transaction expenses of $2.1 million and a loss on disposal of $0.3 million within other operating expenses on the consolidated statements of operations.
3. Exit Costs
Subsequent to the Company’s acquisition of Voortman, activities were initiated to transition Voortman’s distribution model to the Company’s direct-to-warehouse distribution model. The Company incurred costs to exit Voortman’s direct-store-delivery model, including severance and contract termination costs related to third-party distributor and leasing relationships. Total costs were $12.9 million through completion of the transition in 2020. During the year ended December 31, 2020, contract termination costs of $8.3 million were recognized in selling expense on the consolidated statement of operations and $4.6 million of severance costs were recognized within general and administrative expenses on the consolidated statement of operations.
Reserves for these activities are reported within accrued expenses on the consolidated balance sheets and had the following activity during the year ended December 31, 2021 and 2020:
| | | | | | | | | | | | | | | | | | | | |
| (In thousands) | | Severance | | Contract Termination | | Total |
| Charges recorded | | $ | 4,632 | | | $ | 8,278 | | | $ | 12,910 | |
| Payments made | | (4,063) | | | (7,913) | | | (11,976) | |
| Impact of change in exchange rates on CAD denominated liability | | (33) | | | (365) | | | (398) | |
| Reserve balance as of December 31, 2020 | | 536 | | | — | | | 536 | |
| Payments made | | (536) | | | — | | | (536) | |
| Reserve balance as of December 31, 2021 | | $ | — | | | $ | — | | | $ | — | |
4. Stock-Based Compensation
The Hostess Brands, Inc. 2016 Equity Incentive Plan (the “2016 Plan”) provides for the granting of various equity-based incentive awards to members of the Board of Directors of the Company, employees and service providers to the Company. The types of equity-based awards that may be granted under the 2016 Plan include: stock options, stock appreciation rights (SARs), restricted stock, restricted stock units (RSUs), and other stock-based awards. There are 7,150,000 registered shares of Class A common stock reserved for issuance under the 2016 Plan. All awards issued under the 2016 Plan may only be settled in shares of Class A common stock. As of December 31, 2021, 2,128,990 shares remained available for issuance under the 2016 Plan.
Share-based compensation expense totaled approximately $9.6 million, $8.7 million and $9.2 million for the years ended December 31, 2021, 2020 and 2019, respectively.
Restricted Stock Units (“RSUs”)
The fair value of RSU awards is calculated based on the closing market price of the Company’s Class A common stock on the date of grant. Compensation expense is recognized straight-line over the requisite service period of the awards, ranging from one to three years.
The vesting of certain RSU awards is contingent upon the Company’s Class A common stock achieving a certain total stockholder return (“TSR”) in relation to a group of its peers, measured over a three year period. Depending on the actual performance over the measurement period, an award recipient has the opportunity to receive up to 200% of the granted awards. At December 31, 2021, 2020 and 2019, there were 359,388, 411,549, and 319,657 RSU awards with TSR performance conditions outstanding, respectively.
HOSTESS BRANDS, INC.
NOTES TO CONSOLIDATED FINANCIAL STATEMENTS
Upon an employee’s termination, certain RSU awards provide that unvested awards will be forfeited and the shares of common stock underlying such awards will become available for issuance under the 2016 Plan. Other RSU awards provide for accelerated vesting upon an employee’s termination under certain circumstances.
The following table summarizes the activity of the Company’s unvested RSUs: | | | | | | | | | | | |
| Restricted Stock
Units | | Weighted Average
Grant Date
Fair Value |
| Unvested as of December 31, 2019 | 904,135 | | | $ | 12.99 | |
| Total Granted | 628,801 | | | 12.99 | |
| Forfeited | (198,677) | | | 12.17 | |
| Vested(1) | (285,991) | | | 14.54 | |
| Unvested as of December 31, 2020 | 1,048,268 | | | $ | 13.95 | |
| Total Granted | 953,256 | | | 14.78 | |
| Forfeited | (394,859) | | | 14.62 | |
| Vested (2) | (467,138) | | | 13.60 | |
| Unvested as of December 31, 2021 | 1,139,527 | | | $ | 14.62 | |
(1) Includes 78,728 shares withheld to satisfy $1.1 million of employee tax obligations upon vesting.
(2) Includes 92,440 shares withheld to satisfy $1.7 million of employee tax obligations upon vesting.
As of December 31, 2021 there was $9.6 million of total unrecognized compensation cost, related to non-vested RSUs granted under the 2016 Plan; that cost is expected to be recognized over a weighted average remaining period of approximately 1.8 years. As of December 31, 2021 there were no awards outstanding for which it was not probable that the performance conditions would be met.
For the years ended December 31, 2021, 2020 and 2019, $7.9 million, $6.3 million and $7.2 million, respectively, of compensation expense related to the RSUs was recognized within general and administrative expenses on the consolidated statements of operations.
Stock Options
The following table includes the significant inputs used to determine the fair value of options issued under the 2016 plan.
| | | | | | |
| | | Year Ended
December 31,
2020 |
| Expected volatility (1) | | 26.3% |
| Expected dividend yield (2) | | —% |
| Expected option term (3) | | 6.00 years |
| Risk-free rate (4) | | 1.6% |
(1)The expected volatility assumption was calculated based on a peer group analysis of stock price volatility with a look back period based on the expected term and ending on the grant date.
(2)From its inception through December 31, 2021, the Company has not paid any dividends on its common stock. As of the stock option grant date, it was assumed that no dividends would be paid on common stock over the term of the stock options. Option holders have no right to dividends prior to the exercise of the options.
(3)The Company utilized the simplified method to determine the expected term of the stock options since the Company does not have sufficient historical exercise data to provide a reasonable basis upon which to estimate expected term.
(4)The risk-free interest rate was based on the U.S. Treasury yield curve in effect at the time of grant which corresponds to the expected term of the stock options.
HOSTESS BRANDS, INC.
NOTES TO CONSOLIDATED FINANCIAL STATEMENTS
The stock options vest in equal annual installments on varying dates through 2022. The maximum term under the grant agreement is ten years. As of December 31, 2021, there was $0.9 million of total unrecognized compensation cost related to non-vested stock options outstanding under the 2016 Plan; that cost is expected to be recognized over the vesting periods. For the years ended December 31, 2021, 2020 and 2019, there was $1.7 million, $2.4 million and $2.0 million, respectively, of expense related to the stock options recognized within general and administrative costs on the consolidated statements of operations. The weighted average grant-date fair value of options granted in the years ended December 31, 2020 and 2019 was $4.04, and $3.76, respectively.
The following table summarizes the activity of the Company’s unvested stock options:
| | | | | | | | | | | | | | | | | | | | | | | |
| Number
of
Options | | Weighted Average
Remaining
Contractual Life
(years) | | Weighted
Average
Exercise Price | | Aggregate Intrinsic Value |
| Outstanding as of December 31, 2019 | 1,717,671 | | | 8.35 | | $ | 13.35 | | | |
| Granted | 703,329 | | | — | | | 13.69 | | | |
| Exercised | (44,257) | | | — | | | 11.35 | | | $ | 50,424 | |
| Forfeited | (305,628) | | | — | | | 13.93 | | | |
| Outstanding as of December 31, 2020 | 2,071,115 | | | 7.95 | | $ | 13.43 | | | |
| Exercisable as of December 31, 2020 | 787,671 | | | 7.01 | | $ | 14.20 | | | |
| | | | | | | |
| Exercised | (312,067) | | | — | | | 13.29 | | | 949,237 | |
| Forfeited | (297,163) | | | — | | | 14.42 | | | |
| Outstanding as of December 31, 2021 | 1,461,885 | | | 6.98 | | $ | 13.26 | | | 10,467,312 | |
| Exercisable as of December 31, 2021 | 882,042 | | | 6.55 | | $ | 13.43 | | | 6,161,144 | |
5. Property and Equipment
Property and equipment consists of the following:
| | | | | | | | | | | |
| (In thousands) | December 31,
2021 | | December 31,
2020 |
| | | |
| Land and buildings | $ | 70,692 | | | $ | 59,774 | |
| Right of use assets - operating | 32,192 | | | 31,354 | |
| Machinery and equipment | 299,071 | | | 255,821 | |
| Construction in progress | 26,027 | | | 25,041 | |
| 427,982 | | | 371,990 | |
| Less accumulated depreciation | (92,677) | | | (68,031) | |
| $ | 335,305 | | | $ | 303,959 | |
Depreciation expense was $23.5 million, $23.1 million and $17.2 million for the years ended December 31, 2021, 2020, 2019, respectively.
HOSTESS BRANDS, INC.
NOTES TO CONSOLIDATED FINANCIAL STATEMENTS
6. Segment Reporting
For the years ended December 31, 2021 and 2020, the Company had one reportable segment: Snacking. For the year ended December 31, 2019, the Company had two reportable segments: Snacking and In-Store Bakery. The Company’s Snacking segment consists of sweet baked goods, cookies, wafers and bread products that are sold under the Hostess®, Voortman®, Dolly Madison®, Cloverhill® and Big Texas® brands. The In-Store Bakery segment consisted primarily of Superior on Main® branded and private label products sold through the in-store bakery section of grocery and club stores. The Company divested its In-Store Bakery operations on August 30, 2019.
The Company evaluates performance and allocates resources based on net revenue and gross profit. Information regarding the operations of these reportable segments is as follows:
| | | | | | | | | | | | | | | | | | | |
(In thousands) | Year Ended
December 31,
2021 | | Year Ended
December 31,
2020 | | Year Ended
December 31,
2019 | | |
| | | | | | | |
| Net revenue: | | | | | | | |
| Snacking | $ | 1,142,036 | | | $ | 1,016,609 | | | $ | 878,973 | | | |
| In-Store Bakery | — | | | — | | | 28,702 | | | |
| Net revenue | $ | 1,142,036 | | | $ | 1,016,609 | | | $ | 907,675 | | | |
| | | | | | | |
| Depreciation and amortization (1): | | | | | | | |
| Snacking | $ | 51,681 | | | $ | 54,940 | | | $ | 41,732 | | | |
| In-Store Bakery | — | | | — | | | 1,602 | | | |
| Depreciation and amortization | $ | 51,681 | | | $ | 54,940 | | | $ | 43,334 | | | |
| | | | | | | |
| Gross profit: | | | | | | | |
| Snacking | $ | 409,983 | | | $ | 355,639 | | | $ | 293,648 | | | |
| In-Store Bakery | — | | | — | | | 6,186 | | | |
| Gross profit | $ | 409,983 | | | $ | 355,639 | | | $ | 299,834 | | | |
| | | | | | | |
| Capital expenditures (2): | | | | | | | |
| Snacking | $ | 62,951 | | | $ | 58,953 | | | $ | 35,354 | | | |
| In-Store Bakery | — | | | — | | | 182 | | | |
| Capital expenditures | $ | 62,951 | | | $ | 58,953 | | | $ | 35,536 | | | |
(1)Depreciation and amortization include charges to net income classified as costs of goods sold and general and administrative expenses on the consolidated statements of operations.
(2)Capital expenditures consists of purchases of property and equipment and acquisition and development of software assets paid in cash or acquired through accounts payable.
For the years presented, total assets on the consolidated balance sheets are entirely attributed to the Snacking segment.
HOSTESS BRANDS, INC.
NOTES TO CONSOLIDATED FINANCIAL STATEMENTS
7. Goodwill and Intangible Assets
Goodwill and intangible assets as of December 31, 2021 and 2020 were recognized as part of the Hostess Business Combination and the Voortman and Cloverhill Business acquisitions.
During the year ended December 31, 2019, the Company recognized an impairment charge of $1.0 million related to its In-Store Bakery reporting unit, within other operating expense on the consolidated statement of operations. During the year ended December 31, 2019, the Company divested its In-Store Bakery segment (see Note 2. Business Combinations and Divestitures). Goodwill activity is presented below for the Snacking reportable segment:
| | | | | | | | | |
| (In thousands) | Snacking | | | | |
| | | | | |
| | | | | |
| | | | | |
| Balance as of December 31, 2019 | $ | 535,853 | | | | | |
| Acquisition of Voortman | 170,762 | | | | | |
| | | | | |
| | | | | |
| Balance as of December 31, 2020 and 2021 | $ | 706,615 | | | | | |
| | | | | |
| | | | | |
Intangible assets consist of the following:
| | | | | | | | | | | |
| (In thousands) | December 31,
2021 | | December 31,
2020 |
| Intangible assets with indefinite lives (Trademarks and Trade Names) | $ | 1,538,631 | | | $ | 1,538,631 | |
| Intangible assets with definite lives (Customer Relationships) | 526,813 | | | 526,813 | |
| Less accumulated amortization (Customer Relationships) | (121,052) | | | (97,541) | |
| | | |
| Intangible assets, net | $ | 1,944,392 | | | $ | 1,967,903 | |
The Company recognized additional trade names and customer relationships intangible assets during the year ended December 31, 2020 related to the acquisition of Voortman. See Note 2. Business Combinations and Divestitures for additional details.
Amortization expense was $23.5 million, $26.5 million and $23.4 million for the years ended December 31, 2021, 2020 and 2019 respectively.
Future expected amortization expense is as follows:
| | | | | |
| (In thousands) | |
| 2022 | $ | 23,512 | |
| 2023 | 23,512 | |
| 2024 | 23,512 | |
| 2025 | 22,751 | |
| 2026 | 22,751 | |
| 2027 and thereafter | 289,723 | |
HOSTESS BRANDS, INC.
NOTES TO CONSOLIDATED FINANCIAL STATEMENTS
8. Accrued Expenses
Included in accrued expenses are the following:
| | | | | | | | | | | | | | |
| (In thousands) | December 31,
2021 | | | December 31,
2020 |
| | | | |
| Incentive compensation | $ | 21,172 | | | | $ | 16,199 | |
| Payroll, vacation and other compensation | 7,791 | | | | 9,886 | |
| Accrued interest | 4,828 | | | | 4,815 | |
| Interest rate and foreign currency contracts | 2,042 | | | | 13,694 | |
| Other | 11,176 | | | | 11,121 | |
| | | | |
| | | | |
| $ | 47,009 | | | | $ | 55,715 | |
9. Tax Receivable Agreement
Concurrent with the Hostess Business Combination, the Company entered into a tax receivable agreement that generally provides for the payment by the Company to the legacy equity holders of Hostess Holdings of 85% of the net cash savings, if any, in U.S. federal, state and local income taxes that the Company realizes (or is deemed to realize in certain circumstances) in periods after the closing of the business combination (which periods may extend, unless the tax receivable agreement is terminated early in accordance with its terms, for more than 15 years following any exchange of Class B Units of Hostess Holdings for shares of the Company’s Class A common stock or the cash equivalent thereof) as a result of (i) certain increases in tax basis resulting from the 2016 acquisition; (ii) certain tax attributes of Hostess Holdings and its subsidiaries existing prior to the 2016 acquisition and prior to subsequent exchanges of Class B Units; (iii) certain increases in tax basis resulting from exchanges of Class B Units; (iv) imputed interest deemed to be paid by the Company as a result of payments it makes under the tax receivable agreement; and (v) certain increases in tax basis resulting from payments the Company makes under the tax receivable agreement. The Company will retain the benefit of the remaining 15% of these cash savings. Certain payments under the tax receivable agreement will be made to the Metropoulos Entities in accordance with specified percentages, regardless of the source of the applicable tax attribute. The Company recognizes a liability on the consolidated balance sheet based on the undiscounted estimated future payments under the tax receivable agreement. Significant inputs used to estimate the future expected payments include a 26.2% cash tax savings rate.
The following table summarizes activity related to the tax receivable agreement obligations:
| | | | | | | | |
| (In thousands) | | |
| | |
| | |
| | |
| | |
| | |
| Balance December 31, 2019 | | $ | 138,196 | |
| Exchange of Class B units for Class A shares | | 27,915 | |
| Remeasurement due to tax law change | | 610 | |
| Remeasurement due to change in estimated state tax rate | | 150 | |
| Payments | | (10,327) | |
| Balance December 31, 2020 | | $ | 156,544 | |
| Remeasurement due to change in estimated state tax rate | | (1,409) | |
| Payments | | (9,270) | |
| Balance December 31, 2021 | | $ | 145,865 | |
HOSTESS BRANDS, INC.
NOTES TO CONSOLIDATED FINANCIAL STATEMENTS
As of December 31, 2021 the future expected payments under the tax receivable agreement are as follows:
| | | | | |
| (In thousands) | |
| 2022 | $ | 11,600 | |
| 2023 | 10,300 | |
| 2024 | 10,100 | |
| 2025 | 9,400 | |
| 2026 | 9,600 | |
| Thereafter | 94,865 | |
10. Debt
On January 3, 2020, the Company originated a $140.0 million incremental term loan through an amendment to its existing credit agreement. The Company received proceeds of $136.9 million, net of fees incurred of $3.1 million. The proceeds, together with cash on hand, financed the purchase of Voortman (see Note 2. Business Combinations and Divestitures). The terms, conditions and covenants applicable to the incremental term loan are the same as the terms, conditions and covenants applicable to the Fourth Term Loan, defined below. The term loan requires quarterly payments of interest at a rate of the greater of the applicable LIBOR or 0.75% per annum plus a margin of 2.25% per annum and principal payments at a rate of 0.25% of the aggregate principal balance per quarter with the remaining principal amount due upon maturity on August 3, 2025.
A term loan was originated on October 1, 2019 through an amendment to an existing credit agreement held by the Company’s subsidiary, Hostess Brands, LLC (referred to as the “Fourth Term Loan”). It requires quarterly payments of interest at a rate of the greater of the applicable LIBOR or 0.75% per annum (“New LIBOR Floor”) plus a margin of 2.25% per annum and principal at a rate of 0.25% of the aggregate principal balance with the remaining principal amount due upon maturity on August 3, 2025. The Fourth Term Loan is secured by substantially all of Hostess Brands, LLC’s present and future assets.
The Fourth Term Loan refinanced the remaining balance of $976.4 million on the Third New First Lien Term Loan (“Third Term Loan”) through a non-cash refinancing transaction. The Third Term Loan was originated through an amendment to an existing credit agreement held by Hostess Brands, LLC on November 20, 2017 and required quarterly payments of interest at a rate equal to the New LIBOR Floor plus a margin of 2.50% per annum and principal at a rate of 0.25% of the aggregate principal balance.
A summary of the carrying value of the debt and the lease obligations is as follows:
| | | | | | | | | | | | | | |
| (In thousands) | December 31,
2021 | | | December 31,
2020 |
Term loan (3.0% as of December 31, 2021) | | | | |
| Principal | $ | 1,091,596 | | | | $ | 1,102,763 | |
| Unamortized debt premiums, discounts and issuance costs | (3,679) | | | | (4,917) | |
| 1,087,917 | | | | 1,097,846 | |
| Lease obligations | 26,228 | | | | 29,002 | |
| Total debt and lease obligations | 1,114,145 | | | | 1,126,848 | |
| Less: Amounts due within one year | (14,170) | | | | (13,811) | |
| Long-term portion | $ | 1,099,975 | | | | $ | 1,113,037 | |
At December 31, 2021 and 2020, the approximate fair value of the Company’s aggregate term loan balance was $1,090.2 million and $1,109.3 million, respectively. The fair value is calculated using current interest rates and pricing from financial institutions (Level 2 inputs).
HOSTESS BRANDS, INC.
NOTES TO CONSOLIDATED FINANCIAL STATEMENTS
At December 31, 2021, minimum debt repayments under the Fourth Term Loan are due as follows:
| | | | | |
| (In thousands) | |
| 2022 | $ | 11,167 | |
| 2023 | 11,167 | |
| 2024 | 11,167 | |
| 2025 | 1,058,095 | |
Revolving Credit Facility
On October 1, 2019, Hostess Brands, LLC amended its Revolving Credit Agreement (the “Revolver”), providing for borrowings up to $100.0 million, a stated maturity date of August 3, 2024 and secured by liens on substantially all of Hostess Brands, LLC’s present and future assets, including accounts receivable and inventories, as defined in the Revolver. The Revolver is ranked equally with the Fourth Term Loan in regards to secured liens. The Revolver has an annual commitment fee on the unused portion of between 0.375% and 0.50% annually based upon the unused percentage. Interest on borrowings under the Revolver is, at Hostess Brands, LLC’s option, either the applicable LIBOR plus a margin of 2.25% per annum or the base rate plus a margin of 1.25% per annum.
Prior to the amendment, the Revolver originated on August 3, 2015 had interest on borrowings at Hostess Brands, LLC’s option, of either the applicable LIBOR plus a margin of between 3.00% and 3.50% per annum or the base rate plus a margin of 2.00% to 2.50% per annum.
The Company had no outstanding borrowings under the Revolver as of December 31, 2021 or 2020. See Note 15. Commitments and Contingencies for information regarding the letters of credit, which reduce the amount available for borrowing under the Revolver. The Revolver contains certain restrictive financial covenants. As of December 31, 2021, the Company was in compliance with these covenants.
11. Derivative Instruments
Warrants
As part of its initial public offering in 2015, the Company issued public and private placement warrants. Each warrant entitled its holder to purchase one-half of one share of Class A common stock at an exercise price of $5.75 per half share, to be exercised only for a whole number of shares of Class A common stock. As of December 31, 2021 there were no public or private placement warrants outstanding. As of December 31, 2020, 53,936,776 public warrants and 541,658 private placement warrants were outstanding.
In July 2021, the agreement governing the Company’s public and private placement warrants was amended. Subsequent to the amendment, the exercise price for all outstanding warrants was payable through a “cashless exercise” with a premium of $0.25 added to the valuation price of each share for purposes of calculating the number of shares issuable upon exercise of the warrants. Subsequent to this amendment, 51,595,844 warrants were exercised on a cashless basis, resulting in the issuance of 9,822,909 shares of the Company’s Class A common stock. All remaining warrants expired on November 4, 2021.
The warrant agreement contained a tender offer provision that when paired with a two-class equity structure caused all warrants to be precluded from equity classification. Subsequent to the collapse of the two-class structure in November 2020 when all remaining Class B shares were exchanged for Class A shares, the tender offer provision no longer precluded the public warrants from being equity-classified. As a result, the $68.5 million liability related to the public warrants was reclassified to equity in November 2020. There were provisions specific to the private warrants which caused them to continue to be liability classified subsequent to the exchange, through their final expiration in November 2021. The fair value of the warrants is measured on a recurring basis by comparison to available market information. The value of each public warrant up until they were no longer classified as liabilities was based on the public trading price of the warrant (Level 1 fair value measurement). The fair value of each private warrant was evaluated and determined to be substantially the same as that of a public warrant and therefore considered to be a Level 2 fair value measurement. Gains and losses related to the warrants are reflected in the change in fair value of warrant liabilities in the consolidated statements of operations.
HOSTESS BRANDS, INC.
NOTES TO CONSOLIDATED FINANCIAL STATEMENTS
Interest Rate Swaps
To reduce the effect of interest rate fluctuations, the Company entered into an interest rate swap contract with a counter party to make a series of payments based on a fixed interest rate of 1.78% in addition to term loan margin of 2.25% and receive a series of payments based on the greater of LIBOR or 0.75%. Both the fixed and floating payment streams are based on a notional amount of $500 million at the inception of the contract and are reduced by $100 million each year of the five-year contract. As of December 31, 2021, the notional amount was $100 million. The Company entered into this transaction to reduce its exposure to changes in cash flows associated with its variable rate debt and has designated this derivative as a cash flow hedge. At December 31, 2021, the interest on the Company’s variable rate debt hedged by this contract is effectively fixed at 4.03%.
In 2020, the Company entered into additional five-year interest rate swap contracts to further reduce the effect of interest rate fluctuations on its variable-rate debt. The notional value of these contracts was $500 million. Under the terms of the contracts, the Company makes quarterly payments based on fixed interest rates ranging from 1.11% to 1.64% in addition to term loan margin of 2.25% and receives quarterly payments based on the greater of LIBOR or 0.75%. The Company has designated these contracts as cash flow hedges. At December 31, 2021, the interest on the Company's variable rate debt hedged by these contracts is effectively fixed at rates ranging from 3.36% to 3.89%.
In February 2022, the Company entered into a three-year interest rate swap contract with a notional value of $200 million to further reduce the effect of interest rate fluctuations on its variable-rate term loan. Under the terms of the contract, the Company will make quarterly payments based on a fixed interest rate of 2.06% in addition to term loan margin of 2.25% and receive quarterly payments based on the greater of LIBOR or 0.75%.
Foreign Currency Contracts
To reduce the effect of fluctuations in CAD denominated expenses relative to their U.S. dollar equivalents originating from its Canadian operations, the Company entered into CAD purchase contracts during the years ended December 31, 2021 and 2020. The contracts that remain outstanding at December 31, 2021 provide for the Company to sell a total of $12.4 million USD for $15.5 million of CAD at varying defined settlement dates through the end of 2022. The Company has designated these contracts as cash flow hedges.
In connection with the agreement to purchase Voortman as described in Note 2. Business Combinations and Divestitures, the Company entered into a deal-contingent foreign currency contract to hedge the $440 million CAD forecasted purchase price and a portion of the subsequent expected conversion costs. The contract was settled in cash following the completion of the purchase on January 3, 2020.
A summary of the fair value of foreign currency and interest rate contracts is as follows:
| | | | | | | | | | | | | | |
| (In thousands) | | December 31,
2021 | | December 31,
2020 |
| Asset derivatives | Location | | | |
| Interest rate swap contracts (1) | Other non-current assets | $ | 1,803 | | | $ | — | |
| | | | |
| Liability derivatives | Location | | | |
| | | | |
| Interest rate swap contracts (1) | Accrued expenses | $ | 1,798 | | | $ | 13,688 | |
| Foreign currency contracts (2) | Accrued expenses | 244 | | | 6 | |
| | $ | 2,042 | | | $ | 13,694 | |
(1) The fair values of interest rate swap contracts are measured on a recurring basis by netting the discounted future fixed cash payments and the discounted expected variable cash receipts. The variable cash receipts are based on the expectation of future interest rates (forward curves) derived from observed market interest rate curves (Level 2).
(2) The fair values of foreign currency contracts are measured on a recurring basis by comparison to available market information on similar contracts (Level 2).
HOSTESS BRANDS, INC.
NOTES TO CONSOLIDATED FINANCIAL STATEMENTS
A summary of the gains and losses related to foreign currency and interest rate contracts in the consolidated statements of operations is as follows:
| | | | | | | | | | | | | | | | | | | | |
| (In thousands) | | Year Ended
December 31,
2021 | | Year Ended
December 31,
2020 | | Year Ended
December 31,
2019 |
| | | | | | |
| Gain (loss) on derivative contracts designated as cash flow hedges | Location | | | | | |
| Interest rate swap contracts | Interest expense, net | $ | (4,563) | | | $ | (3,886) | | | $ | 1,705 | |
| Foreign currency contracts | Cost of goods sold | 60 | | | — | | | — | |
| | $ | (4,503) | | | $ | (3,886) | | | $ | 1,705 | |
| | | | | | |
| Gain (loss) on other derivative contracts | Location | | | | | |
| Foreign currency contracts | Gain on foreign currency contract | $ | — | | | $ | — | | | $ | 7,128 | |
| Foreign currency contracts | Other expense | — | | | (274) | | | — | |
| | $ | — | | | $ | (274) | | | $ | 7,128 | |
For interest rate swap contracts, unrealized expense recognized in accumulated other comprehensive income as of December 31, 2021 of $3.5 million is expected to be reclassified into interest expense through December 31, 2022.
For foreign currency contracts, unrealized expense recognized in accumulated other comprehensive income as of December 31, 2021 of $0.2 million is expected to be reclassified into cost of goods sold through December 31, 2022.
12. Equity
The Company’s authorized common stock consists of three classes: 200,000,000 shares of Class A common stock, 50,000,000 shares of Class B Stock, and 10,000,000 shares of Class F common stock (none of which were issued and outstanding at December 31, 2021 or 2020). As of December 31, 2021 there were 142,031,329 shares of Class A common stock issued, 138,278,573 shares of Class A common stock outstanding and 3,752,756 shares of treasury stock. As of December 31, 2020 there were 130,791,908 shares of Class A common stock issued, 130,347,464 shares of Class A common stock outstanding and 444,444 shares of treasury stock. As of December 31, 2021 and 2020 there were no shares of Class B Stock issued or outstanding.
Shares of Class A common stock and Class B Stock have identical voting rights. However, shares of Class B Stock do not participate in earnings or dividends of the Company. During the year ended December 31, 2020, all remaining outstanding Class B Units were exchanged for Class A common Stock. Ownership of shares of Class B Stock was restricted to owners of Class B Units in Hostess Holdings. Class B Units in Hostess Holdings could be exchanged (together with the cancellation of an equivalent number of shares of Class B Stock) by the holders thereof for, at the election of the Company, shares of Class A common stock or the cash equivalent of such shares.
During the year ended December 31, 2020, the Company’s Board of Directors approved a securities repurchase program of up to $100 million of the Company’s outstanding securities. As of December 31, 2021, $38.9 million remained available for use under this program.
HOSTESS BRANDS, INC.
NOTES TO CONSOLIDATED FINANCIAL STATEMENTS
13. Earnings Per Share
Basic earnings per share is calculated by dividing net income attributable to the Company’s Class A stockholders for the period by the weighted average number of Class A common shares outstanding for the period excluding non-vested restricted stock awards. In computing dilutive earnings per share, basic earnings per share is adjusted for the assumed issuance of all applicable potentially dilutive share-based awards, including: public and private placement warrants, RSUs, restricted stock awards, and stock options.
Below are basic and diluted earnings per share: | | | | | | | | | | | | | | | | | | | |
| Year Ended December 31, 2021 | | Year Ended
December 31,
2020 | | Year Ended
December 31,
2019 | | |
| Numerator: (in thousands) | | | | | | | |
| Net income attributable to Class A stockholders - basic | $ | 119,299 | | | $ | 104,676 | | | $ | 4,299 | | | |
| Impact of change in fair value of warrant liabilities | (566) | | | (39,941) | | | — | | | |
| Numerator for diluted earnings per share | $ | 118,733 | | | $ | 64,735 | | | $ | 4,299 | | | |
| Denominator: | | | | | | | |
| Weighted-average Class A shares outstanding - basic (excluding non-vested restricted stock awards) | 131,571,733 | | | 124,927,535 | | | 110,540,264 | | | |
| Dilutive effect of warrants | 5,841,062 | | | 2,525,863 | | | — | | | |
| Dilutive effect of RSUs | 588,250 | | | 270,090 | | | 465,425 | | | |
| Dilutive effect of stock options | 197,131 | | | — | | | — | | | |
| Weighted-average shares outstanding - diluted | 138,198,176 | | | 127,723,488 | | | 111,005,689 | | | |
| Earnings per Class A share - basic | $ | 0.91 | | | $ | 0.84 | | | $ | 0.04 | | | |
| Earnings per Class A share - dilutive | $ | 0.86 | | | $ | 0.51 | | | $ | 0.04 | | | |
| | | | | | | |
For warrants that are liability-classified, during periods when the impact is dilutive, the Company assumes share settlement of the instruments as of the beginning of the reporting period and adjusts the numerator to remove the change in fair value of the warrant liability and adjusts the denominator to include the dilutive shares calculated using the treasury stock method.
Stock options that were excluded from the computation of diluted weighted average shares, because their effect was anti-dilutive were 2,010, 477,923 and 365,551 for the years ended December 31, 2021, 2020 and 2019, respectively.
HOSTESS BRANDS, INC.
NOTES TO CONSOLIDATED FINANCIAL STATEMENTS
14. Income Taxes
The income tax expense (benefit) consisted of the following:
| | | | | | | | | | | | | | | |
| (In thousands) | | Year Ended December 31, 2021 | Year Ended
December 31,
2020 | Year Ended
December 31,
2019 | |
| Current tax expense | | | | | |
| Federal | | $ | 17,430 | | $ | 2,120 | | $ | 1,724 | | |
| State and local | | 4,088 | | 1,479 | | 1,047 | | |
| | | | | |
| Total Current | | 21,518 | | 3,599 | | 2,771 | | |
| | | | | |
| Deferred tax expense (benefit) | | | | | |
| Federal | | 13,509 | | 17,204 | | 14,859 | | |
| State and local | | 3,077 | | 3,750 | | (738) | | |
| Foreign | | 2,409 | | (4,148) | | — | | |
| Total Deferred | | 18,995 | | 16,806 | | 14,121 | | |
| Income tax expense, net | | $ | 40,513 | | $ | 20,405 | | $ | 16,892 | | |
Income (loss) before income taxes consists of the following:
| | | | | | | | | | | | | | | |
| (In thousands) | | Year Ended December 31, 2021 | Year Ended
December 31,
2020 | Year Ended
December 31,
2019 | |
| Earnings before income taxes | | | | | |
| United States | | $ | 149,360 | | $ | 144,075 | | $ | 35,641 | | |
| Foreign | | 10,452 | | (15,373) | | — | | |
| Income before income taxes | | $ | 159,812 | | $ | 128,702 | | $ | 35,641 | | |
For the years ended December 31, 2021, 2020, and 2019, the effective income tax rate differs from the federal statutory income tax rate as explained below:
| | | | | | | | | | | | | | | | | | | | | | |
| | Year Ended December 31, 2021 | | Year Ended
December 31,
2020 | | Year Ended
December 31,
2019 | | |
| U.S. federal statutory income tax rate | | 21.0 | % | | 21.0 | % | | 21.0 | % | | |
| | | | | | | | |
| Change in fair value of warrant liabilities | | (0.1) | | | (6.5) | | | 34.7 | | | |
| State and local income taxes, net of federal benefit | | 5.6 | | | 2.8 | | | 12.3 | | | |
| Income attributable to non-controlling interest | | — | | | (0.6) | | | (8.5) | | | |
| Foreign rate differential | | 0.3 | | | (0.6) | | | — | | | |
| Change in state tax rate | | (1.9) | | | 0.6 | | | (12.8) | | | |
| Tax law change | | — | | | (0.8) | | | — | | | |
| | | | | | | | |
| Other | | 0.5 | | | — | | | 0.7 | | | |
| Effective income tax rate | | 25.4 | % | | 15.9 | % | | 47.4 | % | | |
Deferred income taxes are provided for the effects of temporary differences between the tax basis of an asset or liability and its reported amount in the accompanying consolidated balance sheets. These temporary differences result in taxable or deductible amounts in future years.
HOSTESS BRANDS, INC.
NOTES TO CONSOLIDATED FINANCIAL STATEMENTS
Details of the Company’s deferred tax assets and liabilities are summarized as follows:
| | | | | | | | | | | | | | | | |
| (In thousands) | | As of December 31, 2021 | | As of
December 31, 2020 | | |
| Deferred tax assets | | | | | | |
| Imputed interest | | $ | 6,478 | | | $ | 6,744 | | | |
| Tax credits | | 3,011 | | | 4,582 | | | |
| Derivative instruments | | — | | | 3,495 | | | |
| Net operating loss carryforwards | | — | | | 2,601 | | | |
| Accrued liabilities | | 7,080 | | | 4,870 | | | |
| Stock-based compensation | | 3,588 | | | 3,449 | | | |
| Other | | 5,367 | | | 4,443 | | | |
| Total deferred tax assets | | 25,524 | | | 30,184 | | | |
| | | | | | |
| Deferred tax liabilities | | | | | | |
| | | | | | |
| Goodwill and intangible assets | | (291,024) | | | (277,563) | | | |
| Property and equipment | | (51,272) | | | (46,732) | | | |
| Other | | (1,075) | | | (898) | | | |
| Total deferred tax liabilities | | (343,371) | | | (325,193) | | | |
| | | | | | |
| Total deferred tax assets and liabilities | | $ | (317,847) | | | $ | (295,009) | | | |
The recognition of deferred tax assets is based on management’s belief that it is more likely than not that the tax benefits associated with temporary differences, net operating loss carryforwards and tax credits will be utilized. The Company assesses the recoverability of the deferred tax assets on an ongoing basis. In making this assessment, the Company considers all positive and negative evidence, and all potential sources of taxable income including scheduled reversals of deferred tax liabilities, tax-planning strategies, projected future taxable income and recent financial performance.
At December 31, 2021 and 2020, Hostess had gross state credit carryforwards of $3.8 million and $5.8 million respectively. The carryforwards relate primarily to Kansas High Performance Incentive Program credits and will expire in years 2027 and 2036 if not utilized.
At December 31, 2021 and 2020 the Company had $3.1 million and $12.3 million, respectively, of current income taxes receivable included in prepaids and other current assets on the consolidated balance sheet.
The global intangible low-taxed income (“GILTI”) provisions require the Company to include in its U.S. income tax return foreign subsidiary earnings in excess of an allowable return on the foreign subsidiary’s tangible assets. The Company is electing to account for GILTI tax in the period in which it is incurred.
HOSTESS BRANDS, INC.
NOTES TO CONSOLIDATED FINANCIAL STATEMENTS
The Company recognizes in the consolidated financial statements the benefit of a tax position only if the impact is more likely than not of being sustained on audit based on the technical merits of the position. As of both December 31, 2021 and 2020, the Company had $1.6 million of gross unrecognized tax benefits, which would have a net $1.6 million impact on the effective tax rate, if recognized. The following is a reconciliation of the beginning and ending amount of unrecognized tax benefits:
| | | | | | | | | | |
| (In thousands) | | | | |
| Balance at January 1, 2020 | | $ | — | | | |
| Additions for tax positions acquired | | 1,320 | | | |
| Additions for tax positions of current year | | 240 | | | |
| Balance at December 31, 2020 | | 1,560 | | | |
| Additions for tax positions established during prior periods | | 45 | | | |
| | | | |
| Balance at December 31, 2021 | | $ | 1,605 | | | |
Interest and penalties related to income tax liabilities, if incurred, are included in income tax expense in the consolidated statements.
The Company and its subsidiaries file income tax returns in the U.S. federal jurisdiction, various state and local jurisdictions, and certain subsidiaries in Canada. For federal and state tax purposes, the Company and its subsidiaries are generally subject to examination for three years after the income tax returns are filed. As such, U.S. federal and state income tax returns filed for periods since 2017 remain open for examination by tax authorities. In Canada, tax returns are subject to examination for four years after the notice of assessment is issued. Canadian tax returns filed for periods since 2016 remain open for examination.
The Company believes that its foreign subsidiaries have invested or will invest any undistributed earnings indefinitely, or the earnings will be remitted in a tax-neutral transaction, and, therefore, does not provide deferred taxes on the cumulative undistributed earnings of our foreign subsidiaries.
15. Commitments and Contingencies
Accruals and the Potential Effect of Litigation
From time to time, the Company is subject to lawsuits, claims and proceedings arising in the ordinary course of business. These matters may involve personnel and employment issues, personal injury, contracts and other proceedings. Based upon information presently known, the Company does not believe that the ultimate resolution of such matters will have a material effect on the Company’s financial position, although the final resolution of such matters could have a material effect on its results of operations or cash flows in the period of resolution.
Liabilities related to legal proceedings are recorded when it is probable that a liability has been incurred and the associated amount can be reasonably estimated. Where the estimated amount of loss is within a range of amounts and no amount within the range is a better estimate than any other amount, the low end of the range is accrued. As additional information becomes available, the potential liabilities related to these matters are reassessed and the estimates revised, if necessary. These accrued liabilities are subject to change in the future based on new developments in each matter, or changes in circumstances, which could have a material effect on the Company’s financial condition and results of operations.
HOSTESS BRANDS, INC.
NOTES TO CONSOLIDATED FINANCIAL STATEMENTS
Lease Commitments
Operating Leases
As of December 31, 2021 the Company has leases outstanding for certain office spaces, Burlington, Ontario bakery and primary distribution center under noncancellable operating lease arrangements. The future minimum lease payments under these agreements as of December 31, 2021 are shown below.
| | | | | |
| (In thousands) | |
| 2022 | $ | 4,813 | |
| 2023 | 4,467 | |
| 2024 | 5,102 | |
| 2025 | 5,257 | |
| 2026 | 2,735 | |
| Thereafter | 6,890 | |
| Total lease payments | 29,264 | |
| Reconciling impact from discounting | (3,036) | |
| Total lease liabilities | $ | 26,228 | |
Financing Leases
The Company entered into a bond-lease agreement with the Development Authority of Columbus, Georgia on December 1, 2013, which was amended in December, 2016. The bond-lease transaction required the Company to exchange its property to the taxing jurisdiction for tax-exempt bonds issued in the name of the Company not to exceed $18 million. As the issuer and holder of the bonds, the Company is not required to make lease payments. On December 16, 2013, the Company received an ad valorem tax agreement from the Columbus, Georgia Board of Tax Assessors granting tax abatement for the real and personal property located at the Company’s Columbus, Georgia bakery through 2023. The Company has elected to use the right of offset under ASC 210-20 to net the asset and the liability.
HOSTESS BRANDS, INC.
NOTES TO CONSOLIDATED FINANCIAL STATEMENTS
The table below shows the composition of lease expenses for the period:
| | | | | | | | | | | |
| (In thousands) | Year Ended
December 31,
2021 | Year Ended
December 31,
2020 | Year Ended
December 31,
2019 |
| Reduction of right of use asset, financing lease | $ | — | | $ | — | | $ | 133 | |
| Interest, financing lease | — | | — | | 16 | |
| Operating lease expense | 6,420 | | 5,722 | | 3,070 | |
| Short-term lease expense | 1,945 | | 2,633 | | 968 | |
| Variable lease expense | 1,450 | | 1,763 | | 1,076 | |
| $ | 9,815 | | $ | 10,118 | | $ | 5,263 | |
For short-term leases, the Company records rent expense in its consolidated statements of operations on a straight-line basis over the lease term. Variable lease payments, which primarily include taxes, insurance and common area maintenance, are expensed as incurred. Lease expenses are classified as operating activities within the consolidated statements of cash flows. During the year ended December 31, 2020, the Company amended the existing lease for its Burlington, Ontario bakery. The amendment extended the lease term through October 2030 and provided for two five-year extensions, at the Company’s option. During the year ended December 31, 2019, the Company entered into a lease agreement for its new distribution center in Edgerton, Kansas. The agreement has a base term of six and a half years with two five year extensions. The right of use asset and lease liability were calculated using the six and a half year term.
Contractual Commitments
The Company is a party to various long-term arrangements through advance purchase contracts to lock in prices for certain high-volume raw materials and packaging components for normal product production requirements. These advance purchase arrangements are contractual agreements and can only be canceled with a termination penalty that is based upon the current market price of the commodity at the time of cancellation. These agreements qualify for the “normal purchase” exception under accounting standards; and the purchases under these contracts are included as a component of cost of goods sold.
Contractual commitments were as follows:
| | | | | | | | | | | |
| (In thousands) | Total Committed | Commitments within 1 year | Commitments beyond 1 year |
| Ingredients | $ | 102,610 | | $ | 92,955 | | $ | 9,655 | |
| Packaging | 89,906 | | 89,906 | | — | |
During the year ended December 31, 2021, the Company entered into a real estate purchase agreement to acquire a facility in Arkadelphia, Arkansas for a total purchase price of $11.5 million. The transaction closed on February 22, 2022. The facility will become the Company’s sixth bakery in North America upon completion of capital investments to install production lines and other necessary improvements needed to make the facility operational.
Letters of Credit
The Company is a party to Letter of Credit arrangements to provide for the issuance of standby letters of credit in the amount of $6.0 million and $5.5 million for the years ended 2021 and 2020, respectively. The arrangements support the collateral requirements for insurance. The Letters of Credit are 100% secured through our Revolver.
Item 9. Changes in and Disagreements with Accountants on Accounting and Financial Disclosure
None.
Item 9A. Controls and Procedures
(a) Evaluation Of Disclosure Controls And Procedures
We have established disclosure controls and procedures (as defined in Rules 13a-15(e) and 15d-15(e)) of the Securities Exchange Act of 1934, as amended (the “Exchange Act”), that are designed to provide reasonable assurance that information required to be disclosed in our reports filed or submitted under the Exchange Act is recorded, processed, summarized and reported within the time periods specified in the rules and forms of the Securities and Exchange Commission, and that information relating to the Company is accumulated and communicated to management, including our Chief Executive Officer and Interim Chief Financial Officer, as appropriate, to allow timely decisions regarding required disclosure. Under the supervision and with the participation of our management, including our Chief Executive Officer and our Interim Chief Financial Officer, we evaluated the effectiveness of the design and operation of our disclosure controls and procedures as of December 31, 2021, the end of the period covered by this report. Based on that evaluation, the Chief Executive Officer and Interim Chief Financial Officer concluded that our disclosure controls and procedures were effective as of December 31, 2021 at a level of reasonable assurance.
(b) Management’s Report On Internal Control Over Financial Reporting
Our management is responsible for establishing and maintaining adequate internal control over financial reporting, as defined in Exchange Act Rule 13a-15(f). Under the supervision and with the participation of our management, including our Chief Executive Officer and Interim Chief Financial Officer, we conducted an evaluation of the effectiveness of our internal control over financial reporting based on criteria established in Internal Control - Integrated Framework (2013) by the Committee of Sponsoring Organization of the Treadway Commission. Based on that evaluation, our management concluded that our internal control over financial reporting was effective as of December 31, 2021. The effectiveness of the Company’s internal control of financial reporting as of December 31, 2021 has been audited by KPMG LLP, an independent registered public accounting firm, as stated in their report which appears herein.
(c) Changes in Internal Control over Financial Reporting
Subsequent to the filing of our annual report on February 24, 2021, management identified a material weakness in our internal control over financial reporting related to the accounting for and classification of our warrant agreements, due to the lack of an effectively designed control over the evaluation of the underlying clauses of the warrant agreement, and an insufficient understanding of the warrant agreement and accounting literature to reach a correct conclusion. As a result, we concluded that our internal control over financial reporting was not effective as of December 31, 2020.
Since identifying the material weakness, we have implemented changes to our control structure to remediate the control deficiency that gave rise to the material weakness. We remediated this material weakness through testing the operational effectiveness of the controls during the fourth quarter of 2021.
Other than as noted above, during the year ended December 30, 2021, there was no change in our internal control over financial reporting (as defined in Rule 13a-15(f) under the Exchange Act) that has materially affected, or is reasonably likely to materially affect, our internal control over financial reporting.
Item 9B. Other Information
None.
Item 9C. Disclosure Regarding Foreign Jurisdictions that Prevent Inspections
Not applicable.
Item 10. Directors, Executive Officers and Corporate Governance
The information required by this item is contained in our definitive proxy statement, which was filed with the SEC on April 30, 2021, and is incorporated herein by reference.
Item 11. Executive Compensation
The information required by this item is contained in our definitive proxy statement, which was filed with the SEC on April 30, 2021, and is incorporated herein by reference.
Item 12. Security Ownership of Certain Beneficial Owners and Management and Related Stockholder Matters
The information required by this item is contained in our definitive proxy statement, which was filed with the SEC on April 30, 2021, and is incorporated herein by reference.
Item 13. Certain Relationships and Related Transactions, and Director Independence
The information required by this item is contained in our definitive proxy statement, which was filed with the SEC on April 30, 2021, and is incorporated herein by reference.
Item 14. Principal Accountant Fees and Services
Our independent registered public accounting firm is KPMG LLP, Kansas City, MO, Auditor Firm ID: 185.
The information required by this item is contained in our definitive proxy statement, which was filed with the SEC on April 30, 2021, and is incorporated herein by reference.
Part IV.
Item 15. Exhibits, Financial Statement Schedules
Financial Statements and Financial Statement Schedules
See “Index to consolidated financial statements” in Part II, Item 8 of this Annual Report on Form 10-K. Financial statement schedules have been omitted because they are not required or are not applicable or because the information required in those schedules either is not material or is included in the consolidated financial statements or the accompanying notes.
Item 6. Exhibits
| | | | | | | | | | | | | | |
| Exhibit No. | | Description | | |
| 2.2* | | Share Purchase Agreement, dated as of November 29, 2019, by and among Hostess Brands, LLC, SPE Partners V, LP, Pacific Street Fund III, LP, PPM American Private Equity Fund V, LP, the Manufacturers Life Insurance Company, Roynat Capital Inc., Voortman Enterprises Trust, 2727939 Ontario Inc. and the persons listed on Exhibit A thereto (1) | | |
| 3.1 | | | | |
| 3.2 | | | | |
| 4.1 | | | | |
| 4.2 | | | | |
| 10.1 | | Tax Receivable Agreement, dated November 4, 2016, by and among Gores Holdings, Inc., Hostess CDM Co-Invest, LLC, CDM Hostess Class C, LLC, AP Hostess Holdings, L.P., and C. Dean Metropoulos (4) | | |
| 10.2 | | | | |
| 10.3 | | | | |
| 10.4 | | | | |
| 10.5 | | | | |
| 10.6 | | | | |
| 10.7 | | | | |
| 10.8 | | | | |
| 10.9 | | | | |
| 10.10 | | | | |
| 10.11 | | | | |
| 10.12 | | | | |
| 10.13 | | | | |
| 10.14 | | | | |
| 10.15 | | | | |
| 10.16 | | Incremental Assumption and Amendment Agreement No. 5, dated as of January 3, 2020, by and among HB Holdings, LLC, Hostess Brands LLC, certain of Hostess Brands, LLC's subsidiaries, the lenders party thereto, Credit Suisse AG, Cayman Island Branch, as administrative agent and the other parties party thereto.(9) | | |
| 10.17 | | | | |
| 10.18 | | | | |
| 10.19 | | | | |
| 10.20 | | | | |
| 10.21 | | | | |
| 21.1 | | | | |
| 23.1 | | | | |
| | | | | | | | | | | | | | |
| 31.1 | | | | |
| 31.2 | | | | |
| 32.1 | | | | |
| 32.2 | | | | |
| 101.INS | | XBRL Instance Document | | |
| 101.SCH | | XBRL Taxonomy Extension Schema Document | | |
| 101.CAL | | XBRL Taxonomy Extension Calculation Linkbase Document | | |
| 101.DEF | | XBRL Taxonomy Extension Definition Linkbase Document | | |
| 101.LAB | | XBRL Taxonomy Extension Label Linkbase Document | | |
| 101.PRE | | XBRL Taxonomy Extension Presentation Linkbase Document | | |
| 104.1 | | The cover page from this Current Report on Form 8-K, formatted in Inline XBRL | | |
*Schedules and exhibits to this Exhibit omitted pursuant to Regulation S-K Item 601(b)(2). The Company agrees to furnish supplementally a copy of any omitted schedules or exhibits to the SEC upon request.
(1)Filed as an exhibit to the Company’s Annual Report on Form 10-K for the fiscal year ended December 31, 2019 filed with the SEC on February 26, 2020 and incorporated herein by reference.
(2)Filed as an exhibit to the Company’s Quarterly Report on Form 10-Q for the quarter ended June 30, 2020 filed with the SEC on August 5, 2020.
(3)Filed as an exhibit to the Company’s Current Report on Form 8-K filed with the SEC on January 3, 2019 and incorporated herein by reference.
(4)Filed as an exhibit to the Company’s Current Report on Form 8-K filed with the SEC on November 9, 2016 and incorporated herein by reference.
(5)Filed as an exhibit to the Company’s Current Report on Form 8-K filed with the SEC on April 13, 2018 and incorporated herein by reference.
(6)Filed as an exhibit to the Company’s Current Report on Form 8-K filed with the SEC on August 6, 2018 and incorporated herein by reference.
(7)Filed as an exhibit to the Company’s Quarterly Report on Form 10-Q for the quarter ended March 31, 2018 filed with the SEC on May 9, 2018 and incorporated herein by reference.
(8)Filed as an exhibit to the Company’s Annual Report on Form 10-K for the fiscal year ended December 31, 2021 filed with the SEC on February 24, 2021 and incorporated herein by reference.
(9)Filed as an exhibit to the Company’s Current Report on Form 8-K filed with the SEC on January 6, 2020 and incorporated herein by reference.
(10)Filed as an exhibit to the Company's Quarterly Report on Form 10-Q for the quarter ended March 31, 2021 filed with the SEC on May 17, 2021 and incorporated herein by reference.
(11)Filed as an exhibit to the Company’s Current Report on Form 8-K filed with the SEC on November 11, 2021 and incorporated herein by reference.
Pursuant to the requirements of Section 13 or 15(d) of the Securities Exchange Act of 1934, the registrant has duly caused this report to be signed on its behalf by the undersigned, thereunto duly authorized, in Lenexa, Kansas on March 1, 2022.
| | | | | |
| HOSTESS BRANDS, INC. |
| |
| By | /s/ Michael J. Gernigin |
| Michael J. Gernigin
Senior Vice President, Chief Accounting Officer and Interim Chief Financial Officer (Principal Financial Officer) |
Pursuant to the requirements of the Securities Exchange Act of 1934, this report has been signed by the following persons in the capacities and on the date indicated.
| | | | | | | | | | | | | | |
| Signature | | Title | | Date |
| | | |
| /s/ Andrew P. Callahan | | President, Chief Executive Officer (principal executive officer) and Director | | March 1, 2022 |
| Andrew P. Callahan | | | |
| /s/ Michael J. Gernigin | | Senior Vice President, Chief Accounting Officer and Interim Chief Financial Officer (principal financial officer and principal accounting officer) | | March 1, 2022 |
| Michael J. Gernigin | | | |
| /s/ Jerry D. Kaminski | | Chairman and Director | | March 1, 2022 |
| Jerry D. Kaminski | | | |
| /s/ Olu Beck | | Director | | March 1, 2022 |
| Olu Beck | | | | |
| /s/ Laurence Bodner | | Director | | March 1, 2022 |
| Laurence Bodner | | | | |
| /s/ Gretchen R. Crist | | Director | | March 1, 2022 |
| Gretchen R. Crist | | | | |
| /s/ Rachel P. Cullen | | Director | | March 1, 2022 |
| Rachel P. Cullen | | | | |
| /s/ Hugh G. Dineen | | Director | | March 1, 2022 |
| Hugh G. Dineen | | | | |
| /s/ Ioannis Skoufalos | | Director | | March 1, 2022 |
| Ioannis Skoufalos | | | |
| /s/ Craig D. Steeneck | | Director | | March 1, 2022 |
| Craig D. Steeneck | | | |
| | | | |