UNITED STATES
SECURITIES AND EXCHANGE COMMISSION
Washington, D.C. 20549
FORM 10‑K
|
|
x ANNUAL REPORT PURSUANT TO SECTION 13 OR 15(d) OF THE SECURITIES EXCHANGE ACT OF 1934 |
For the fiscal year ended December 31, 2018 |
|
o TRANSITION REPORT PURSUANT TO SECTION 13 OR 15(d) OF THE SECURITIES EXCHANGE ACT OF 1934 |
For the transition period from to |
Commission file number 001‑37540
HOSTESS BRANDS, INC.
(f/k/a GORES HOLDINGS, INC.)
(Exact name of registrant as specified in its charter)
|
| |
Delaware
(State or other jurisdiction of incorporation or organization) | 47‑4168492
(I.R.S. Employer Identification No.) |
1 East Armour Boulevard, Kansas City, MO
(Address of principal executive offices) | 64111
(Zip Code) |
(816) 701‑4600
Registrant’s telephone number, including area code
Securities registered pursuant to Section 12(b) of the Act |
| | |
Title of Each Class | Name of Each Exchange on Which Registered |
Class A Common Stock, par value of $0.0001 per share | NASDAQ Capital Market |
56,499,890 Warrants, each exercisable for half share of Class A Common Stock | NASDAQ Capital Market |
Securities registered pursuant to Section 12(g) of the Act: None.
Indicate by check mark if the Registrant is a well-known seasoned issuer, as defined in Rule 405 of the Securities Act. Yes x No ¨
Indicate by check mark if the Registrant is not required to file reports pursuant to Section 13 or Section 15(d) of the Act. Yes ¨No x
Indicate by check mark whether the registrant (1) has filed all reports required to be filed by Section 13 or 15(d) of the Securities Exchange Act of 1934 during the preceding 12 months (or for such shorter period that the registrant was required to file such reports), and (2) has been subject to such filing requirements for the past 90 days.Yes x No o
Indicate by check mark whether the registrant has submitted electronically and every Interactive Data File required to be submitted pursuant to Rule 405 of Regulation S‑T (§229.405 of this chapter) during the preceding 12 months (or for such shorter period that the registrant was required to submit such files). Yes x No o
Indicate by check mark if disclosure of delinquent filers pursuant to Item 405 of Regulation S-K (§229.405 of this chapter) is not contained herein, and will not be contained, to the best of the Registrant’s knowledge, in definitive proxy or information statements incorporated by reference in Part III of this Form 10-K or any amendment to this Form 10-K o
Indicate by check mark whether the registrant is a large accelerated filer, an accelerated filer, a non‑accelerated filer, a smaller reporting company, or an emerging growth company. See definitions of “large accelerated filer,” “accelerated filer,” “smaller reporting company,” and “emerging growth company” in Rule 12b‑2 of the Exchange Act.:
|
| | | | |
Large accelerated filer x | Accelerated filer o | Non‑accelerated filer o
| Smaller reporting company o | Emerging growth company o |
If an emerging growth company, indicate by check mark if the registrant has elected not to use the extended transition period for complying with any new or revised financial accounting standards provided pursuant to Section 13(a) of the Exchange Act. o
Indicate by check mark whether the registrant is a shell company (as defined in Rule 12b‑2 of the Act). Yes o No x
The aggregate market value of the voting and non-voting common equity held by non-affiliates of the registrant on June 30, 2018, computed by reference to the closing price reported on the NASDAQ Capital Market on such date was $1,352,105,241 (99,419,503 shares at a closing price per share of $13.60).
Shares of Class A common stock outstanding -100,046,392 shares at February 22, 2019
Shares of Class B common stock outstanding - 30,255,184 shares at February 22, 2019
DOCUMENTS INCORPORATED BY REFERENCE
Portions of the Registrant’s definitive proxy statement relating to its 2019 annual meeting of stockholders (the “2019 Proxy Statement”) are incorporated by reference into Part III of this Annual Report on Form 10-K where indicated. The 2019 Proxy Statement will be filed with the U.S. Securities and Exchange Commission within 120 days after the end of the fiscal year to which this report relates.
HOSTESS BRANDS, INC.
FORM 10-K
FOR THE YEAR ENDED DECEMBER 31, 2018
INDEX
|
| | |
| | Page |
Part I |
Item 1. | Business | |
Item 1A. | Risk Factors | |
Item 1B. | Unresolved Staff Comments | |
Item 2. | Properties | |
Item 3. | Legal Proceedings | |
Item 4. | Mine Safety Disclosures | |
Part II |
Item 5. | Market for Registrant’s Common Equity, Related Stockholder Matters and Issuer Purchases of Equity Securities | |
Item 6. | Selected Financial Data | |
Item 7. | Management’s Discussion and Analysis of Financial Condition and Results of Operations | |
Item 7A. | Quantitative and Qualitative Disclosures about Market Risk | |
Item 8. | Financial Statements and Supplementary Data | |
Item 9. | Changes in and Disagreements with Accountants on Accounting and Financial Disclosure | |
Item 9A. | Controls and Procedures | |
Item 9B. | Other Information | |
Part III |
Item 10. | Directors, Executive Officers and Corporate Governance | |
Item 11. | Executive Compensation | |
Item 12. | Security Ownership of Certain Beneficial Owners and Management and Related Stockholder Matters | |
Item 13. | Certain Relationships and Related Transactions, and Director Independence | |
Item 14. | Principal Accounting Fees and Services | |
Part IV |
Item 15. | Exhibits, Financial Statement Schedules | |
Cautionary Note Regarding Forward Looking Statements
This Annual Report on Form 10-K (“Annual Report”) contains statements reflecting our views about our future performance that constitute “forward-looking statements” within the meaning of Section 27A of the Securities Act of 1933, as amended (the “Securities Act”) and Section 21E of the Securities Exchange Act of 1934, as amended (the “Exchange Act”), that involve substantial risks and uncertainties. All statements contained in this Annual Report other than statements of historical fact, including statements regarding our future results of operations and financial position, our business strategy and plans, and our objectives for future operations, are forward-looking statements. Statements that constitute forward-looking statements are generally identified through the inclusion of words such as “believes,” “expects,” “intends,” “estimates,” “projects,” “anticipates,” “will,” “plan,” “may,” “should,” or similar language. Statements addressing our future operating performance and statements addressing events and developments that we expect or anticipate will occur are also considered as forward-looking statements. All forward‑looking statements included herein are made only as of the date hereof. It is routine for our internal projections and expectations to change throughout the year, and any forward-looking statements based upon these projections or expectations may change prior to the end of the next quarter or year. Readers of this Annual Report are cautioned not to place undue reliance on any such forward-looking statements. As a result of a number of known and unknown risks and uncertainties, our actual results or performance may be materially different from those expressed or implied by these forward-looking statements. Risks and uncertainties are identified and discussed in Item 1A-Risk Factors in this Annual Report. All subsequent written or oral forward-looking statements attributable to us or persons acting on our behalf are expressly qualified in their entirety by these risk factors. We undertake no obligation to update any forward-looking statement, whether as a result of new information, future events, or otherwise. The discussion and analysis of our financial condition and results of operations included in Item 7- Management’s Discussion and Analysis of Financial Condition and Results of Operations should be read in conjunction with our consolidated financial statements and related notes included in Item 8 of this Annual Report.
Explanatory Note
Hostess Brands, Inc. (f/k/a Gores Holdings, Inc.) was originally incorporated in Delaware on June 1, 2015 as a special purpose acquisition company or a SPAC, formed for the purpose of effecting a merger, capital stock exchange, asset acquisition, stock purchase, reorganization, or other similar business combination with one or more target businesses. On August 19, 2015, Gores Holdings, Inc. consummated its initial public offering (the “IPO”), following which its shares began trading on the Nasdaq Capital Market (“NASDAQ”).
On November 4, 2016 (the “Closing Date”), in a transaction referred to as the “Hostess Business Combination,” Gores Holdings, Inc. acquired a controlling interest in Hostess Holdings, L.P. (“Hostess Holdings”), an entity owned indirectly by C. Dean Metropoulos (the “Metropoulos Entities”) and certain equity funds managed by affiliates of Apollo Global Management, LLC (the “Apollo Funds” and, together with the Metropoulos Entities, the “Legacy Hostess Equityholders”). Hostess Holdings had acquired the Hostess brand and certain strategic assets out of the bankruptcy liquidation proceedings of its prior owner (“Old Hostess”), free and clear of all past liabilities, in April 2013, and relaunched the Hostess Brand later that year.
In connection with the closing of the Hostess Business Combination, Gores Holdings, Inc. changed its name to Hostess Brands, Inc. and its trading symbols on NASDAQ from “GRSH” and “GRSHW,” to “TWNK” and “TWNKW”.
As a result of the Hostess Business Combination, for accounting purposes, Hostess Brands, Inc. (“we”, “us”, “our” or the “Company”) is the acquirer and Hostess Holdings is the acquired party and accounting predecessor. Our financial statement presentation includes the financial statements of Hostess Holdings and its subsidiaries as “Predecessor” for periods prior to the completion of the Hostess Business Combination and of Hostess Brands, Inc., including the consolidation of Hostess Holdings and its subsidiaries, for periods from and after the Closing Date.
PART I
Item 1. Business
Hostess - Who We Are
We are a leading packaged food company whose brands date back to 1919, when the Hostess® CupCake was introduced, followed by Twinkies® in 1930. Our strategic vision is to be an iconic branded baking company that builds brands and categories to delight our consumers and customers. We seek to leverage our differentiated core competencies of strong brand equity, low cost operating model, collaborative customer partnerships, nimble innovation and significant cash flows to drive profitable growth by engaging consumers with our sweet baked goods while while seeking opportunities in adjacent bakery categories.
Our brands represented 18.0% of the Sweet Baked Goods (“SBG”) category according to Nielsen total universe for the 52-week ended December 29, 2018. We believe our strong brand history and market position in the SBG category combined with our entrepreneurial spirit provide an unparalleled platform to execute our strategic initiatives.
We have invested significantly to upgrade our manufacturing footprint, implement new IT systems and enhance production efficiency through the installation of automated baking and packaging lines. These investments, combined with our Direct-to-Warehouse (“DTW”) distribution model, have re-established our leading, premium brand position within the $6.6 billion U.S. SBG category and have increased our distribution channels and paved new growth opportunities for the Company.
Our DTW distribution model uses centralized distribution centers and common carriers to fill orders, with products generally delivered to our customers’ warehouses. This model has eliminated the need for Direct-Store-Delivery (“DSD”) routes and drivers, which has allowed us to expand our core distribution while gaining access to new channels (e.g., further penetration into convenience, drug store, dollar, foodservice, and cash & carry). We have both renewed and added relationships with retailers and distributors around the country.
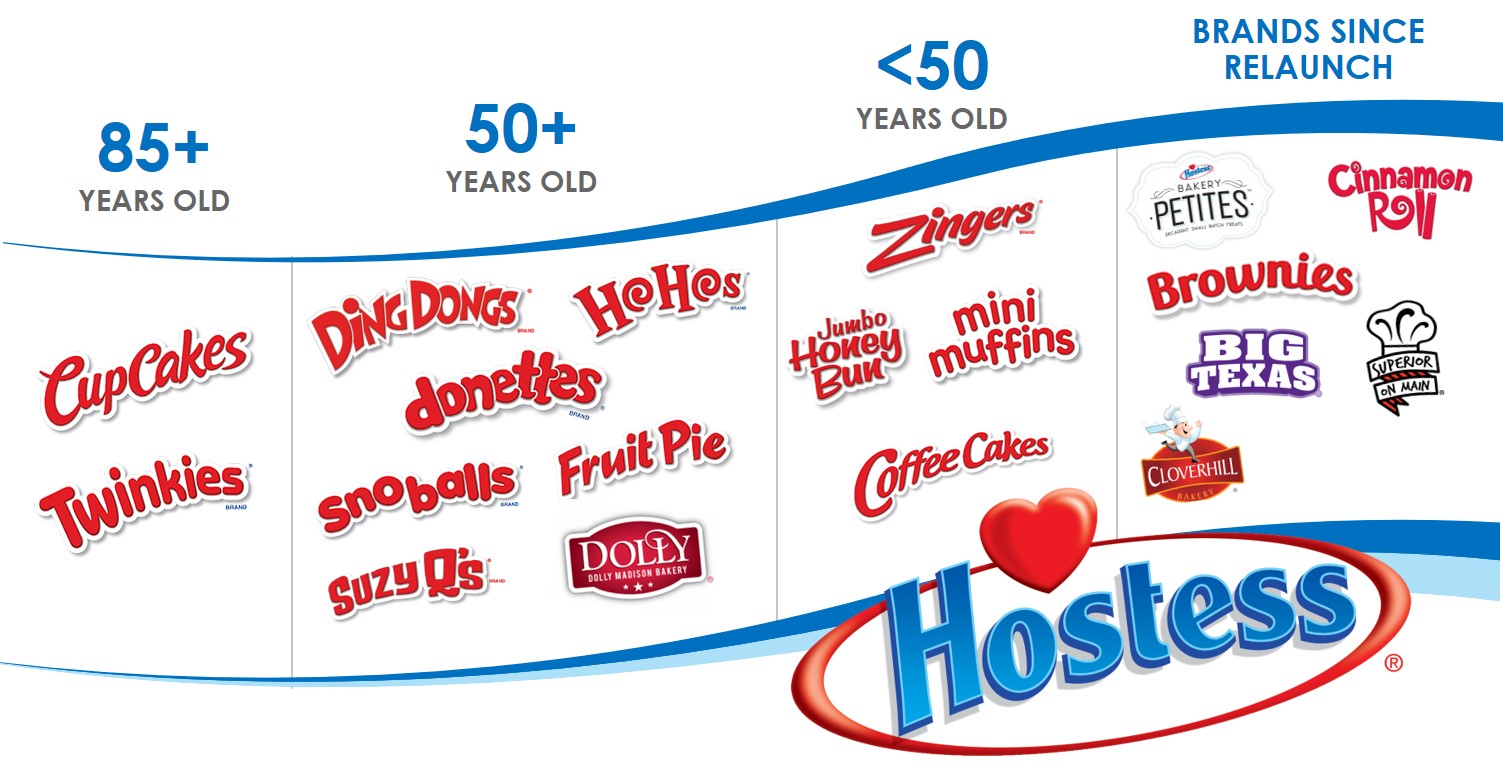
Brands and Products
Hostess® has been an iconic American brand for generations. In 2019, we are celebrating our 100 year anniversary of the launch of our first cupcake and have been building our brands ever since. In May 2016, we acquired the Superior on Main® brands and in February 2018, we acquired the Cloverhill® and Big Texas® brands. We offer a variety of new and classic treats under these brands. The following is a summary of our principal product lines:
Our Growth Strategy
We are executing our growth strategy by optimizing our core brands within SBG and expanding into adjacent categories through innovation, leveraging our highly efficient and profitable business model and executing strategic acquisition opportunities while effectively managing our capital structure.
Optimize the core Hostess Brand and expand into adjacent categories
We believe that we have maintained the Hostess brand power and category awareness for nearly a century by satisfying consumers’ need for fun, light-hearted treats. We believe our portfolio of highly recognized products is synonymous with American snacking. We have established our leadership position in the SBG segment through the strength and quality of our products, developing and promoting a brand that unites our loyal consumer base and by pricing our products at a reasonable premium to other snacking alternatives.
We plan to capitalize on the strength of the Hostess® brand and our attractive retailer economics in order to drive growth by attracting new consumers and increasing the number of stores carrying our products. With the potential afforded by the extended reach of our DTW distribution model, distribution and market share gains are expected to come from traditional channels (“core expansion”) through our investment in quality, targeted marketing, product renovation and a focus on our most effective brands and SKUs. Our top 7 brands represented 67.0% of our net revenue for fiscal year 2018 and 80% of our market share for the 52-weeks ending December 29, 2018.
Our brand strategy, combined with investments in highly effective marketing and brand-building, has resulted in what we believe to be one of the strongest brand equities in snacking. By expanding points of distribution and increasing SKU assortments we plan to continue top line growth in the future. Our top three products (Donettes®, Twinkies® and Cupcakes) have All Commodity Volume (“ACV”) distribution rates in core channels that are significantly higher than the average rate achieved by other products in our portfolio (based on Nielsen 52 weeks ending December 29, 2018). These high levels are directly correlated to our focused approach on our strategic initiatives. By applying this tailored and focused approach to our other existing product lines, we will work with retailers to expand the average number of SKUs offered and attempt to reduce distribution gaps. The average number of products selling at core retailers today is approximately 23 items.
Innovation
Innovation is key to fueling our growth. We are devoted to maintaining our iconic brands while contemporizing them in order to stay relevant with our consumer base and attract new consumers. We believe that to support our premium position, we must continually evolve with changing consumer preferences and trends. We are focused on continuing to innovate and expand our core products by launching new flavors of iconic products to leverage the brand’s power and drive incremental revenue with new limited time offer products.The success of our product innovation is in part driven by understanding consumer preferences, providing awareness and trials by partnering with our customers, all while maintaining our iconic brands and product quality.
We have developed new innovation to attract new consumers, such as our Hostess Bakery Petite®, a premium snacking platform made with no artificial flavors or colors or high fructose corn syrup. We believe there is growth potential in providing further snacking options for ingredient conscious consumers. We are also expanding the Hostess® brands into new consumer segments to drive incremental growth. During 2018, we launched our Totally Nutty®, a peanut butter wafer bar which expands our presence in the cookie/wafer sub-category within the SBG Category.
The breakfast sub-category is also a significant opportunity for us where our share is 16.5%, nearly a 3.0% share gap compared to our All Day Snacking share. This sub-category represents approximately 48.7% of the $6.6 billion SBG category according to Nielsen U.S. total universe for the 52 weeks ended December 29, 2018. According to a July 2016 study by Mintel, convenience and brand preference continue to influence snack selection, as over half of U.S. consumers rate portability as a key attribute in breakfast items. These consumption trends play to our strengths as our products conveniently come packaged in both single-serve and multipack varieties. Our recent acquisition of the Cloverhill® business in Chicago enables us to leverage our current platform and to expand our breakfast capabilities in this significant
consumer segment. In 2018, we launched a line of Hostess® branded multipack danishes and glazed Jumbo Donettes® and have more products on the horizon as we leverage our newly acquired capabilities to expand our breakfast offerings.
The in-store bakery sections of grocery and club retailers are increasingly utilized to provide a differentiated shopping experience and to showcase product offerings. Our Superior on Main® brand includes eclairs, madeleines, brownies, and iced cookies, as well as preservative-free and gluten-free products offered in the in-store bakery section.We continue to penetrate in-store bakery in the grocery and club channels. Our ISB focus is on core product support and seasonality-relevant core extensions by leveraging the Superior on Main® and Private Label market presence and product offerings.
We have had early success with licensing opportunities and are continuing to launch new partnerships which leverage our iconic brands. Our products are also distributed by third parties internationally, including products packed specifically for Mexico, the United Kingdom and Canada. Our products are also sold on various e-commerce platforms.
We also understand the need to continually evolve while maintaining the tradition and offerings our loyal consumer base has come to know and love. We continue to invest in new product development and building our long-term pipeline, leveraging our innovation pipeline and commercialization process to bring new products to market in a timely fashion.
Leverage highly efficient and profitable business model.
When we relaunched the Company, we set out to disrupt the status quo business model of the SBG category. We established our innovative DTW distribution model and heavily invested in our bakeries, which has resulted in energy, labor and time savings, along with the ability to achieve quality products. These investments paved the way for new product innovation.
The DTW model, uses centralized distribution centers and common carriers. Each distribution center is owned and operated by third parties. The distribution centers are able to fill customer orders and reduce inventory on hand as a result of this centralized consolidation of inventory. Products are delivered to customers’ warehouses from the distribution centers using common carriers. A small number of our customers pick up their orders directly from our distribution centers.
The DTW model is enabled by our extended shelf life (“ESL”) technology. As a result of our DTW model, we do not keep a significant backlog of finished goods inventory, as our fresh bakery products are promptly shipped to our distribution centers after being produced. Some of our products are shipped frozen at the request of certain retailers.
We believe our DTW distribution model has created a substantial whitespace opportunity. We have greater access to convenience, drug and dollar stores. Distributing to these channels under a DSD model can be inefficient due to small average drop size. Historically, DSD snack cake companies have competed with candy and tobacco distributors; however, our DTW model has enabled us to partner with these third-party distributors who can profitably penetrate both the convenience store and drug store channels and who are looking for opportunities to gain share in the SBG category. In 2018, convenience and drug stores accounted for 30.4% of our net revenues. We have established a strong presence and market share in the convenience and drug channels and are focused on continuously expanding coverage. These partnerships further expand our distribution reach in a highly efficient manner, and we believe they will add to our growth potential going forward.
We believe that impulse purchase decisions are another fundamental driver of retail sales in the SBG category, which makes prominent in-store placement an essential growth lever. The DTW and centralized distribution model provides us with a competitive advantage through the ability to utilize retail-ready corrugate displays. These pre-built displays are visually impactful, produced economically, and require minimal in-store labor to assemble or load, thus providing cost-efficient display vehicles that benefit the retailer and us alike. Preloaded displays also allow us full control over our brand marketing, which allows us to execute retailer-wide campaigns regionally or nationally in a consistent manner, providing a unique competitive advantage across the entire SBG category, which is predominantly DSD-served.
Our business model is supported by cost-advantaged manufacturing and distribution, expanded channel/retail store reach and enhanced in-store merchandising capabilities, and offers retailers attractive margins that incentivize further distribution of our products.
We have invested nearly $250 million in the business since the re-launch in 2013 and anticipate continued investment in the business to further our strategic initiatives. Our capital investment focus will be on operational capabilities that directly support or expand our growth and innovation. Further, we anticipate continued investment in automation, which allows for improved product quality, consistency and efficiency.
Platform for future acquisitions
We believe we serve as a platform for growth through acquisitions. Within the fragmented consumer packaged goods market, there exists the opportunity to drive value creation through acquisitions by leveraging our brand, platform, infrastructure and performance-driven management culture. We are committed to seeking-out opportunities that add new capabilities to our already broad offerings.
The 2018 acquisition and integration of the Cloverhill® business in Chicago, IL, is an example where we are leveraging our warehouse model and expanding our breakfast capabilities. The transformation and significant capital investment we have made in this facility has provided us with a platform to leverage our brand in the breakfast sub-category. As we explore other opportunities, we will consider our ability to leverage our existing brands or reinvigorate acquired brands within the Baking category. We will also consider our ability to integrate the acquisition with our existing SBG business and the opportunities to generate synergies through production on our existing assets and leveraging of our warehouse model.
We believe our scale, access to capital and management experience will allow us to consider both small and large acquisitions in the future and to integrate them in a seamless fashion.
The Category: Large and Attractive
Nearly all U.S. consumers eat snacks at least once per day. The U.S. SBG category is one of the largest categories within the broader $74 billion U.S. Total Snack category, with estimated retail sales of $6.6 billion in 2018 according to Nielsen U.S. total universe for the 52 weeks ended December 29, 2018. The SBG category includes breakfast items (e.g., donuts, breakfast danishes, and muffins) and all-day snacking items (e.g., snack cakes, pies, bars, brownies, blondies, and cookies). According to The Nielsen Company, the Sweet Snacks category (Candy, Cookies, Desserts, Fruit Snacks, and SBG) accounted for 50% of the Total Snacks category dollars.
Since its reintroduction to the market in 2013, the Hostess® brand has contributed significantly to the total growth of the SBG category. During the Hostess® brand’s hiatus from 2012 to 2013 the category declined by 8%. From the reintroduction of Hostess® through December 31, 2018, the SBG category has grown 15%.
During 2018, point of sale for our combined brands grew $14.8 million representing 70.5% of total category growth. Our combined brand’s 18.0% share of the category represents an opportunity for continued growth in comparison to its pre-hiatus share of 22.8%.
Competitive landscape
Hostess® is #2 in the U.S. SBG category. The top three brands, Hostess, Little Debbie, and Entenmanns account for 62% of the SBG retail sales according to Nielsen, while the rest of the category remains fairly fragmented. With limited private label penetration in the category (3.9% market share vs. 17.4% for overall packaged food), consumers have shown a strong preference for trusted brands within the SBG category. The leading positions are solidified through extensive product portfolios, strong brand awareness, established distribution capabilities and long-standing relationships with critical high-volume retailers. Furthermore, high levels of capital investment are required to establish manufacturing and distribution capabilities of meaningful scale, providing additional barriers to entry.
We face competition from other brands, large national bakeries, smaller regional operators, supermarket chains with their own private label brands, and grocery stores with their own in-store bakery departments. The key competitive factors in the industry include product quality, price, customer service, brand recognition and loyalty, promotional activities, access to retail outlets, sufficient shelf-space and ability to identify and satisfy consumer preferences. Some of our largest national competitors include Flowers Foods, Inc., Grupo Bimbo, S.A. and McKee Foods Corporation. In addition, we also compete with regional sweet goods branded manufacturers and other companies, including in the ISB space, that produce cookies, candies and other sweet snacks. At times, we experience pricing pressure in certain of our markets from competitor promotions and other pricing practices. However, we believe our brand recognition, product quality and innovation have generated consumer loyalty to many of our products which helps mitigate this impact.
Seasonality
Sweet baked goods revenues tend to be moderately seasonal, with declines during the early winter period, which we believe are attributable to altered consumption patterns during the holiday season. We expect this trend to continue and continue to be applicable to our business. We strive to mitigate the seasonality by running certain targeted promotional campaigns.
Production
We produce Hostess®, Dolly Madison®, Cloverhill® and Big Texas® products at four bakeries located in Emporia, Kansas; Columbus, Georgia; Indianapolis, Indiana; and Chicago, Illinois. In-store bakery products are produced at two bakeries located in Southbridge, Massachusetts. We have invested heavily in baking and packaging technology to improve productivity and efficiency, including installing two Auto-bake systems and fully-automated packaging systems. A portion of our products are co-manufactured and packaged under our brands and sold through our distribution facilities.
Our state of the art Auto-bake technologies have resulted in significant energy, labor and time savings. The technology provides fully-automated industrial baking ovens and systems, combining cost efficient, compact and continuous baking solutions that can be custom configured. We have also invested in our Auto-bake lines, equipment that fully-automates the packaging process (from wrapping to palletizing).
Raw Materials
Our principal raw materials are flour, sweeteners, edible oils and compound coating, as well as corrugate and films used to package our products. We utilize various buying strategies to lock in prices for various raw materials and packaging to reduce the impact of commodity price fluctuations. In addition, we are dependent on natural gas as fuel for firing our ovens. Our third-party common carriers use gasoline and diesel as fuel for their trucks.
We have strategic, long-term relationships with our key suppliers for our raw materials and packaging that help leverage our buying power. While the cost of some raw materials has, and may continue to increase or decrease over time, we believe that we will be able to purchase an adequate supply of raw materials as needed. We also sole source certain raw materials. We have multiple vendors that meet our supply requirements for the sole sourced materials, except in the case of the enzymes used in our ESL technology. With respect to the enzymes, we continue to evaluate other sources in order to maintain business continuity and flexibility.
Customers
Our top 10 customers in 2018 accounted for 58.6% of total net revenue. During 2018, our largest customer, Wal-Mart and affiliates, represented 21.0% of our net revenue. No other customer accounted for more than 10% of 2018 net revenue. The loss of, or a material negative change in, our relationship with Wal-Mart or any of our other top 10 customers could have a material adverse effect on our business. Our customers include mass merchandisers, supermarkets and other retailers and distributors, convenience, drug and dollar store.
Trademarks and Other Intellectual Property
We believe that our intellectual property has substantial value and has contributed to the success of our business. In particular, our trademarks, including our registered Hostess®, Dolly Madison®, Cloverhill®, and Big Texas® brand trademarks and our sub-brand trademarks, including Twinkies®, Ding Dongs®, Ho Hos®, Zingers®, Sno Balls®, and Donettes®, are valuable assets that we believe reinforce our consumers’ favorable perception of our products. This value provides us the opportunity to sell our products at premium price points and pursue licensing opportunities.
From time to time, third parties have used names similar to ours, have applied to register trademarks similar to ours and, we believe, have infringed or misappropriated our intellectual property rights. Third parties have also, from time to time, opposed our trademarks and challenged our intellectual property rights. We respond to these actions on a case-by-case basis. We rely on laws and regulations, as well as contractual restrictions, to protect our intellectual property and proprietary rights.
Research and Development
The majority of our research and development spend is dedicated to enhancing and expanding our product lines, responding to changing consumer preferences and trends and continuing to enhance the taste of our products. In addition, our research and development organization provides technical support to ensure that our core products are consistently produced in accordance with our high standards of quality and specifications. Finally, this department is charged with developing processes to reduce our costs without adversely affecting the quality of our products.
Government Regulation
Our operations, including the manufacturing, processing, formulating, packaging, labeling and advertising of products, are subject to regulation by various federal agencies, including the Food and Drug Administration (the “FDA”), the Federal Trade Commission (the “FTC”), and the Environmental Protection Agency (the “EPA”). Our products are subject to various local, state, and federal laws, regulations and administrative practices affecting our business. We must comply with provisions regulating registrations and licensing, health and sanitation standards, current Good Manufacturing Practices and traceability, hazard analysis and risk-based preventative controls, food labeling, equal employment, wage and hour requirements, and environmental protection, among others. We take compliance and the safety of our products seriously and take all steps that we consider necessary or appropriate to comply with all applicable laws, rules and regulations.
Experienced Team
The Company’s culture is an integral part of our strategy, built on entrepreneurship, innovation, collaboration and a competitive spirit. Embodying these tenets is a strong and experienced team, led by both Dean Metropoulos, our Chairman, and Andy Callahan, our President and Chief Executive Officer.
Mr. Metropoulos has been involved in many successful transactions involving brands such as Chef Boyardee, Duncan Hines, Ghirardelli Chocolate, Bumble Bee Tuna, Pabst Blue Ribbon, Premier Foods (the biggest UK food company), and Mumm and Perrier Jouet Champagnes. Dean Metropoulos has over 30 years of experience revamping iconic brands throughout the consumer space.
Mr. Callahan has served as a director of Hostess Brands, Inc. since April 2018 and has served as President and Chief Executive Officer of Hostess Brands, Inc. and its subsidiaries since May 2018. He has more than 20 years of executive leadership experience serving in key consumer packaged goods industry roles at Tyson Foods, the Hillshire Brands Company, Sara Lee Corporation and Kraft Foods.
Our management team is complemented by an experienced Board of Directors, all of whom have senior executive leadership and bring with them extensive consumer products knowledge. Our board members and management include:
|
| | |
Board of Directors: | | Management: |
Mr. C. Dean Metropoulos, Chairman | | Andy P. Callahan, President and Chief Executive Officer |
Andy P. Callahan, Director | | Thomas A. Peterson, Executive Vice President - Chief Financial Officer |
Laurence Bodner, Director | | Michael J. Cramer, Executive Vice President - Chief Administrative Officer |
Gretchen Crist, Director | | Andrew W. Jacobs, Executive Vice President - Chief Operating Officer |
Neil DeFoe, Director | | John Kalal, Senior Vice President of Bakery Operations and Supply Chain |
Jerry Kaminski, Director | | Darryl P. Riley, Senior Vice President of Quality, Food Safety and R&D |
Craig Steeneck, Director | | Jolyn J. Sebree, Senior Vice President - General Counsel |
A detailed biography of each of our board members and key management team members can be found at www.hostessbrands.com. Unless expressly stated otherwise, the information contained on or accessible through our website is not incorporated by reference into this Annual Report on Form 10-K.
As of December 31, 2018, we employed approximately 2,000 people. Of our total workforce, approximately 90% were located at our bakery facilities. The remaining workers comprised functions including operations management, sales and supply chain, among other corporate functions. We have entered into collective bargaining agreements with the local unions of the Bakery, Confectionery, Tobacco Workers and Grain Millers Union in Indianapolis, Indiana and Columbus, Georgia, and the Chemical Production Workers Union Local No. 30 in Chicago, Illinois. Approximately 800 employees are covered by these collective bargaining agreements. We consider our relations with employees to be good and have not experienced a strike or significant work stoppage.
Employee Safety and Environmental Sustainability
We are committed to keeping our employees safe, protecting the environment and providing developmental opportunities for our employees. We endeavor to be a company of energized people and to be a good corporate citizen.
Our goal is to create a higher standard of living and quality of life for our employees and our communities. We believe new automation, safety investments and behavioral safety training have resulted in higher employee engagement and lower workers’ compensation costs. We meet periodically with local and state leaders to discuss business planning and ways to become a better community partner with educational, municipal and regulatory agencies. We promote participation in charitable organizations and make philanthropic donations in some of the communities where we operate. We also routinely donate a portion of our excess production to food banks in areas where we operate.
Available Information
This discussion of the business should be read in conjunction with, and is qualified by reference to, Management's Discussion and Analysis of Financial Condition and Results of Operations ("MD&A") under Item 7 herein. In addition, the information set forth under the headings "Forward Looking Statements," and "Introduction" in the MD&A and the segment and geographic information included in Item 8, Financial Statements and Supplementary Data - Note 5, "Segment Reporting" are incorporated herein by reference in partial response to this Item 1.
The Company’s Internet website address is www.hostessbrands.com. The Company makes available free of charge (other than an investor’s own Internet access charges) through its Internet website its Annual Report on Form 10-K,
Quarterly Reports on Form 10-Q, Current Reports on Form 8-K, and amendments to those reports, on the same day they are electronically filed with, or furnished to, the Securities and Exchange Commission. The Company is not including the information contained on or available through its website as a part of, or incorporating such information by reference into, this Annual Report on Form 10-K.
Item 1A. Risk Factors
You should carefully consider the following risk factors, together with all of the other information included in this Annual Report on Form 10-K. The risks described below are those which we believe are the material risks that we face. Additional risks not presently known to us or which we currently consider immaterial may also have an adverse effect on us. Any risk described below may have a material adverse impact on our business or financial condition. Under these circumstances, the trading price of our common stock could decline, and you may lose all or part of your investment.
Risks Related to Our Business
Maintaining, extending and expanding our reputation and brand image are essential to our business success.
We have many iconic brands with long-standing consumer recognition. Our success depends on our ability to maintain our brand image for our existing products, extend our brands to new platforms, and expand our brand image with new product offerings.
We seek to maintain, extend, and expand our brand image through marketing investments, including advertising and consumer promotions, and product innovation. Increasing attention on the role of food marketing could adversely affect our brand image. It could also lead to stricter regulations and greater scrutiny of marketing practices. Existing or increased legal or regulatory restrictions on our advertising, consumer promotions and marketing, or our response to those restrictions, could limit our efforts to maintain, extend and expand our brands. Moreover, adverse publicity about regulatory or legal action against us could damage our reputation and brand image, undermine our customers’ confidence and reduce long-term demand for our products, even if the regulatory or legal action is unfounded or not material to our operations.
In addition, our success in maintaining, extending, and expanding our brand image depends on our ability to adapt to a rapidly changing media environment. We increasingly rely on social media and online dissemination of advertising campaigns. Social and digital media increases the speed and extent that information or misinformation and opinions can be shared. Negative posts or comments about us, our brands or our products on social or digital media, whether or not valid, could seriously damage our brands and reputation. If we do not maintain, extend, and expand our brand image, then our product sales, financial condition and operating results could be materially and adversely affected.
Our intellectual property rights are valuable, and our failure to protect them could reduce the value of our products and brands.
We consider our intellectual property rights, including our trademarks, trade names, copyrights, trade secrets and trade dress, to be a significant and valuable part of our business. We attempt to protect our intellectual property rights by taking advantage of a combination of applicable laws, copyright registrations, trademark registrations and/or applications for our trademarks, third-party agreements (including non-disclosures, assignments, distribution and/or manufacturing, licenses, consents and co-existence) and policing and enforcement of third-party misuse or infringement of our intellectual property. Our failure to obtain or adequately protect our intellectual property rights, or any change in law or other changes that serve to lessen or remove the current legal protections of our intellectual property, may diminish our competitiveness and could materially harm our business. In addition, third-party claims of intellectual property infringement might require us to pay monetary damages or enter into costly license agreements. We also may be subject to injunctions against development and sale of certain of our products.
Any litigation regarding intellectual property (including third-party infringement claims or litigation initiated by us to protect our intellectual property rights) could be costly and time-consuming and could divert management’s and other key personnel’s attention from our business operations. Any of the occurrences outlined above could materially and adversely affect our reputation, product sales, financial condition and operating results.
We may be unable to leverage our brand value to compete against lower-priced alternative brands.
In most of our product categories, we compete with lower-priced alternative products. Our products must provide higher value and/or quality to our consumers than alternatives, particularly during periods of economic uncertainty. Consumers may not buy our products if relative differences in value and/or quality between our products and retailer or other economy brands change in favor of competitors’ products or if consumers perceive this type of change. If consumers choose the lower-priced brands, then we could lose market share or sales volumes, which could materially and adversely affect our product sales, financial condition, and operating results.
We may be unable to correctly predict, identify and interpret changes in consumer preferences and demand and offer new products or methods of distribution to meet those changes.
Consumer preferences for food and snacking products change continually. Our success will depend on our ability to predict, identify and interpret the tastes, dietary habits, purchasing behavior and other preferences of consumers and to offer products that appeal to these preferences. Moreover, weak economic conditions, recession or other factors could affect consumer preferences and demand. If we do not offer products that appeal to consumers or if we misjudge consumer demand for our products, our sales and market share will decrease and our profitability could suffer.
We continually introduce new products or product extensions and our operating results and growth will depend upon the market reception of such new products. There can be no assurance that new products will find widespread acceptance among consumers, and unsuccessful product launches may decrease our profitability and damage our brands’ reputation.
The continued prevalence of e-commerce and other methods of distribution outside of traditional retail shopping could also impact our sales and profitability if we are unable to adequately modify the marketing and distribution of our products in response.
In addition, prolonged negative perceptions concerning the health implications of certain food products could influence consumer preferences and acceptance of some of our products and marketing programs. For example, consumers are increasingly focused on health and wellness, and aware of product ingredients such as added sugar and artificial flavors or colors. We might be unsuccessful in our efforts to effectively respond to changing consumer preferences and social expectations. Continued negative perceptions and failure to satisfy consumer preferences could materially and adversely affect our reputation, product sales, financial condition and operating results.
We operate in a highly competitive industry.
The SBG industry is highly competitive. Numerous brands and products compete for shelf space and sales, with competition based primarily on product quality, brand recognition and loyalty, price, trade promotion, consumer promotion, customer service, and the ability to identify and satisfy emerging consumer preferences. We face competition from other large national bakeries, smaller regional operators, supermarket chains with their own private labeled brands, grocery stores with their own in-store bakery departments and diversified food companies. Our competitors include a significant number of companies of varying sizes, including divisions, subdivisions, or subsidiaries of larger companies. Many of these competitors have multiple product lines, substantially greater financial and other resources available to them, and may be substantially less leveraged than us. We may not be able to compete successfully with these companies. Competitive pressures or other factors could cause us to lose market share, which may require us to lower prices, increase marketing and advertising expenditures, or increase the use of discounting or promotional campaigns, each of which could materially and adversely affect our margins and could result in a decrease in our operating results and profitability.
Our growth may be limited by our inability to maintain or add additional shelf or retail space for our products.
Our results will depend on our ability to drive revenue growth, in part, by expanding the distribution channels for our products. However, our ability to do so may be limited by our inability to secure additional shelf, display, or other retail space for our products. Retail space for sweet baked goods is limited and subject to competitive and other pressures, and there can be no assurance that retail operators will provide us sufficient space for our products to enable us to meet our growth objectives. If we are unable to maintain or increase our retail space, we could experience an adverse impact on our product sales, financial condition and operating results.
Our success will depend on our continued ability to produce and successfully market products with extended shelf life.
We have invested to extend our product shelf life, while maintaining our products’ taste, texture and quality. Extended shelf life, or ESL, is an important component of our DTW model. Our ability to produce and successfully market existing and new products with ESL, while maintaining taste, texture and quality, is essential to our success. If we are unable to continue to produce products with ESL or if the products are not accepted by consumers, we could be forced to make changes to our distribution model and that could have an adverse effect on our product sales, financial condition and operating results.
If we do not successfully integrate and manage our acquired businesses or brands, our operating results may adversely be affected.
From time to time, we acquire businesses or brands to expand our product portfolio and distribution. We may incur unforeseen liabilities and obligations in connection with the acquisition, integration, or management of the acquired businesses or brands and may encounter unexpected difficulties and costs in integrating them into our operating and internal control structures. We may also experience delays in extending our internal control over financial reporting to a newly acquired business, which may increase the risk of failure to prevent misstatements in their financial records and in our consolidated financial statements. Our financial performance depends in large part on how well we can manage and improve the performance of acquired businesses or brands. We cannot assure you; however, that we will be able to achieve our strategic and financial objectives for such acquisitions. If we are unable to achieve such objectives, our financial condition operating results could be negatively affected.
We may be unable to drive revenue growth in our key products or add products that are faster-growing and more profitable.
The SBG industry’s overall growth is linked to population growth. Our future results will depend on our ability to drive revenue growth in our key products. Because our operations are concentrated in the United States where growth in the SBG industry has been moderate, our success also depends in part on our ability to enhance our portfolio by adding innovative new products. There can be no assurance that new products will find widespread acceptance among consumers. Our failure to drive revenue growth in our key products or develop innovative new products could materially and adversely affect our profitability, financial condition and operating results.
The cost to manufacture our products is subject to pricing volatility.
We purchase and use large quantities of commodities, including flour, sweeteners, edible oils and compound coating to manufacture our products. In addition, we purchase and use significant quantities of corrugate and films to package our products.
Prices for commodities, energy, transportation and other inputs are volatile and can fluctuate due to conditions that are difficult to predict, including global competition for resources, currency fluctuations, severe weather or global climate change, consumer, industrial or investment demand and changes in governmental regulation and trade, alternative energy, and agricultural programs. Rising commodity, energy, transportation and other input costs could materially and adversely affect our cost of operations, which could materially and adversely affect our financial condition and operating results.
Although we monitor our exposure to commodity prices as an integral part of our overall risk management program, and seek to utilize forward buying strategies through short-term and long-term advance purchase contracts, to lock in prices for certain high-volume raw materials, packaging components and fuel inputs, these strategies may not protect us from increases in specific raw materials costs.
Continued volatility or sustained increases in the prices of commodities, transportation and other supplies we purchase could increase the costs of our products, and our profitability could suffer. Moreover, increases in the prices of our products to cover these increased costs may result in lower sales volumes. If we are not successful in our buying strategies, or if we are unable to price our products to cover increased costs, then commodity and other input price volatility or increases could materially and adversely affect our financial condition and operating results.
We may be limited in our ability to pass cost increases on to our customers in the form of price increases or may realize a decrease in sales volume in the event price increases are implemented.
We may not be able to pass some or all of any increases in the price of raw materials, energy, and other input costs to our customers by raising prices. In the event we increase our prices, customers and consumers may choose to purchase competing products or may shift purchases to private label or other lower-priced offerings, which may adversely affect our operating results.
Consumers may be less willing or able to pay a price differential for our branded products, and may increasingly purchase lower-priced offerings and may forego some purchases altogether, especially during economic downturns. Retailers may also increase levels of promotional activity for lower-priced offerings as they seek to maintain sales volumes during times of economic uncertainty. Accordingly, sales volumes of our branded products could be reduced or lead to a shift in sales mix toward our lower-margin offerings. As a result, decreased demand for our products may adversely affect our operating results.
The ability to distribute our products is subject to significant changes in the availability and pricing of transportation.
We utilize third-party carriers to ship our products to customers. The availability of timely and reliable transportation and the associated costs are subject to market demand, carrier capacity, fuel prices and regulatory oversight. Our procurement of transportation services from a diversified group of carriers and continuous monitoring of carrier usage and pricing could be insufficient to protect us from changes in market demand or carrier capacity.
If we lose one or more of our major customers, or if any of our major customers experience significant business interruption, our operating results could be adversely affected.
We have several large customers that account for a significant portion of our sales. Wal-Mart together with its affiliates is our largest customer and represented approximately 21.0% of our net revenue for the year ended December 31, 2018. Cumulatively, including Wal-Mart, our top ten customers accounted for 58.6% of net revenue for the year ended December 31, 2018.
We do not have long-term supply contracts with any of our major customers. The loss of one or more major customers, a material reduction in sales to these customers for any reason, or the occurrence of a significant business interruption of our customers’ operations would result in a decrease in our product sales, financial condition and operating results.
Our geographic focus makes us particularly vulnerable to economic and other events and trends in the United States.
We operate in the United States and, therefore, are particularly susceptible to adverse United States regulations, economic climate, consumer trends, market fluctuations, including commodity price fluctuations or supply shortages of our key ingredients, and other adverse events. The concentration of our businesses in the United States could present challenges and may increase the likelihood that an adverse event in the United States would materially and adversely affect our product sales, financial condition and operating results.
The consolidation of retail customers could adversely affect us.
Retail customers may continue to consolidate, resulting in fewer customers for our business. Consolidation also produces larger retail customers that may seek to leverage their position to improve their profitability by demanding improved efficiency, lower pricing, increased promotional programs, or specifically tailored products. In addition, larger retailers have the scale to develop supply chains that permit them to operate with reduced inventories or to develop and market their own retailer brands. Retail consolidation and increased retailer power could materially and adversely affect our product sales, financial condition, and operating results.
Retail consolidation also increases the risk that adverse changes in our customers’ business operations or financial performance will have a corresponding material and adverse effect on us. For example, if our customers cannot access sufficient funds or financing, then they may delay, decrease, or cancel purchases of our products, or delay or fail to pay us for previous purchases, which could materially and adversely affect our product sales, financial condition, and operating results.
Our results could be adversely impacted as a result of increased labor and employee-related expenses.
Inflationary pressures and any shortages in the labor market could increase labor costs, which could have a material adverse effect on our consolidated operating results or financial condition. Our labor costs include the cost of providing
employee benefits, including health and welfare, and severance benefits. The annual costs of benefits vary with increased costs of health care and the outcome of collectively-bargained wage and benefit agreements.
Various federal and state labor laws govern our relationships with our employees and affect operating costs. These laws include employee classifications as exempt or non-exempt, minimum wage requirements, unemployment tax rates, workers’ compensation rates, overtime, family leave, safety standards, payroll taxes, citizenship requirements and other wage and benefit requirements for employees classified as non-exempt. As our employees are paid at rates set above, but related to, the applicable minimum wage, further increases in the minimum wage could increase our labor costs. Significant additional government regulations could materially adversely affect our business, financial condition and operating results.
Higher health care costs and labor costs due to statutory and regulatory changes could adversely affect our business.
Under the United States Patient Protection and Affordable Care Act (the “ACA”), we are required to provide affordable coverage, as defined in the ACA, to all employees, or otherwise be subject to a payment per employee based on the affordability criteria in the ACA. Additionally, some states and localities have passed state and local laws mandating the provision of certain levels of health benefits by some employers. Increased health care and insurance costs could have a material adverse effect on our business, financial condition and operating results. In addition, changes in federal or state workplace regulations could adversely affect our business, financial condition and operating results.
A portion of our workforce belongs to unions. Failure to successfully negotiate collective bargaining agreements, or strikes or work stoppages could cause our business to suffer.
Approximately 40.0% of our employees, as of December 31, 2018, are covered by collective bargaining agreements and other employees may seek to be covered by collective bargaining agreements. Strikes or work stoppages or other business interruptions could occur if we are unable to renew these agreements on satisfactory terms or enter into new agreements on satisfactory terms, which could impair manufacturing and distribution of our products or result in a loss of sales, which could adversely impact our business, financial condition or operating results. The terms and conditions of existing, renegotiated or new collective bargaining agreements could also increase our costs or otherwise affect our ability to fully implement future operational changes to enhance our efficiency or to adapt to changing business needs or strategy.
We may be subject to product liability claims should the consumption of any of our products cause injury, illness or death.
We sell food products for human consumption, which involves risks such as product contamination or spoilage, mislabeling, product tampering and other adulteration of food products. Consumption of a mislabeled, adulterated, contaminated or spoiled product may result in personal illness or injury. We could be subject to claims or lawsuits relating to an actual or alleged illness or injury, and we could incur liabilities that are not insured or exceed our insurance coverage. Even if product liability claims against us are not successful or fully pursued, these claims could be costly and time consuming and may require our management to spend time defending the claims rather than operating the business. In addition, publicity regarding these claims could adversely affect our reputation and brands.
Product recalls may increase our costs, negatively impact our brands’ reputation, and adversely affect our business.
A product that has been actually or allegedly misbranded or becomes adulterated could result in product withdrawals or recalls, destruction of product inventory, negative publicity, temporary plant closings, substantial cost of compliance or remediation, and potentially significant product liability judgments against us. Any of these events could result in a loss of demand for our products, which would have a material adverse effect on our financial condition, operating results or cash flows. We could also be adversely affected if consumers lose confidence in our product quality, safety and integrity generally.
Unanticipated business disruptions could adversely affect our ability to provide our products to our customers.
Factors that are hard to predict or beyond our control, like weather, natural disasters, fire, explosions, terrorism, political unrest, generalized labor unrest or health pandemics could damage or disrupt our operations. In addition, our operations could be disrupted by a material equipment failure. We do not have significant redundant operating equipment to allow for such disruptions. Accordingly, if we do not effectively respond to disruptions in our operations, for example, by replacing capacity at our manufacturing locations, or cannot quickly repair damage to our information, production or
supply systems, we may be late in delivering or unable to deliver products to our customers. If that occurs, we may lose our customers’ confidence, and long-term consumer demand for our products could decline. These events could materially and adversely affect our product sales, financial condition and operating results.
We rely on third parties for services related to sales, marketing and distribution.
We utilize third-party sales and marketing services, centralized distribution centers and common carriers to execute order fulfillment for the majority of our products. While these services have increased our market penetration and expanded our distribution reach, we are dependent upon these third parties to effectively market, sell and distribute our products. We do not have long-term contracts with any of these third-party service providers. Accordingly, any termination by a third-party provider of their services to us, or any failure by these third parties to perform their obligations to us, would have a material adverse impact on our business and operating results.
We may not successfully identify or complete strategic acquisitions, alliances, divestitures or joint ventures.
From time to time, we may evaluate acquisition candidates, alliances or joint ventures that may strategically fit our business objectives, or we may consider divesting businesses that do not meet our strategic objectives or growth or profitability targets. These activities may present financial, managerial, and operational risks, including, but not limited to, diversion of management’s attention from existing core businesses. In addition, to the extent we undertake acquisitions, alliances or joint ventures or other developments outside our core geography or in new categories, we may face additional risks related to such developments. Any of these factors could materially and adversely affect our product sales, financial condition, and operating results.
Legal claims or other regulatory enforcement actions could subject us to civil and criminal penalties.
As a large food company, we operate in a highly regulated environment with constantly evolving legal and regulatory frameworks. Various laws and regulations govern food production, storage, distribution, sales, advertising and marketing, as well as licensing, trade, labor, tax and environmental matters, and health and safety practices. Government authorities regularly change laws and regulations and their interpretations. Consequently, we are subject to heightened risk of legal claims or other regulatory enforcement actions. Although we have implemented policies and procedures designed to ensure compliance with existing laws and regulations, there can be no assurance that our employees, contractors, or agents will not violate our policies and procedures. Moreover, a failure to maintain effective control processes could lead to violations, unintentional or otherwise, of laws and regulations. Legal claims or regulatory enforcement actions arising out of our failure or alleged failure to comply with applicable laws and regulations could subject us to civil and criminal penalties that could materially and adversely affect our product sales, reputation, financial condition, and operating results.
Our insurance may not provide adequate levels of coverage against claims.
We believe that we maintain insurance customary for businesses of our size and type. However, there are types of losses we may incur that cannot be insured against or that we believe are not economically reasonable to insure. Such losses could have a material adverse effect on our business and operating results.
We are subject to laws and regulations relating to protection of the environment, worker health, and workplace safety. Costs to comply with these laws and regulations, or claims with respect to environmental, health and safety matters, could have a significant negative impact on our business.
Our operations are subject to various federal, state and local laws and regulations relating to the protection of the environment, including those governing the discharge of pollutants into the air and water, the management and disposal of solid and hazardous materials and wastes, employee exposure to hazards in the workplace and the cleanup of contaminated sites. We are required to obtain and comply with environmental permits for many of our operations, and sometimes we are required to install pollution control equipment or to implement operational changes to limit air emissions or wastewater discharges and/or decrease the likelihood of accidental releases of hazardous materials. We could incur substantial costs, including cleanup costs, civil or criminal fines or penalties, and third-party claims for property damage or personal injury as a result of any violations of environmental laws and regulations, noncompliance with environmental permit conditions or contamination for which we may be responsible that is identified or that may occur in the future. Such costs may be material.
Under federal and state environmental laws, we may be liable for the costs of investigation, removal or remediation of certain hazardous or toxic substances, as well as related costs of investigation and damage to natural resources, at various properties, including our current and former properties and the former properties of our predecessors, as well as off-site waste handling or disposal sites that we or our predecessors have used. Liability may be imposed upon us without regard to whether we knew of or caused the presence of such hazardous or toxic substances. Any such locations we currently own or occupy, or locations that we may acquire in the future, may result in liability to us under such laws or expose us to third-party actions such as tort suits based on alleged conduct or environmental conditions. In addition, we may be liable if hazardous or toxic substances migrate from properties for which we may be responsible to other properties.
In addition to regulations applicable to our operations, failure by any of our suppliers to comply with regulations, or allegations of compliance failure, may disrupt their operations and could result in potential liability. Even if we were able to obtain insurance coverage or compensation for any losses or damages resulting from the noncompliance of a supplier with applicable regulations, our brands and reputation may be adversely affected by negative perceptions of our brands stemming from such compliance failures.
We cannot predict what environmental or health and safety legislation or regulations will be enacted in the future or how existing or future laws or regulations will be enforced, administered or interpreted. We also cannot predict the amount of future expenditures that may be required in order to comply with such environmental or health and safety laws or regulations or to respond to environmental claims.
Our operations are subject to regulation by the FDA, FTC and other governmental entities, and such regulations are subject to change from time to time which could impact how we manage our production and sale of products.
Our operations are subject to extensive regulation by the FDA, the FTC and other national, state, and local authorities. For example, we are subject to the Food, Drug and Cosmetics Act (“FDCA”) and regulations promulgated thereunder by the FDA. This comprehensive regulatory program governs, among other things, the manufacturing, processing composition and ingredients, packaging, holding and safety of food. Under this program, the FDA regulates manufacturing practices for foods through, among other things, its current “good manufacturing practices” regulations, or CGMPs, and specifies the ingredients for certain foods. Our processing facilities and products are subject to periodic inspection by federal, state, and local authorities. The Food Safety Modernization Act increased the number of inspections at food facilities in the United States in an effort to enhance the detection of food-borne illness outbreaks and order recalls of tainted food products. It also imposes greater responsibility upon factors throughout the food chain to design and implement effective preventive controls in food safety programs throughout the supply chain. The FTC and other authorities regulate how we market and advertise our products, and we could be the target of claims relating to alleged false or deceptive advertising under federal, state, and foreign laws and regulations. Changes in these laws or regulations or the introduction of new laws or regulations could increase the costs of doing business for us or our customers or suppliers or restrict our actions, causing our operating results to be adversely affected.
We seek to comply with applicable regulations through a combination of employing internal personnel to ensure quality-assurance compliance and contracting with third-party laboratories that conduct analysis of products for the nutritional-labeling requirements. Compliance with regulations is costly and time-consuming. Failure to comply with applicable laws and regulations or maintain permits and licenses relating to our operations could subject us to civil remedies, including fines, injunctions, recalls or seizures, as well as potential criminal sanctions, which could result in increased operating costs resulting in a material adverse effect on our business, financial condition, and operating results.
Significant additional labeling or warning requirements or limitations on the marketing or sale of our products may reduce demand for such products and could adversely affect our business or operating results.
Certain jurisdictions in which our products are made, manufactured, distributed or sold have either imposed, or are considering imposing, product labeling or warning requirements or limitations on the marketing or sale of certain of our products as a result of ingredients or substances contained in such products. These types of provisions have required that we provide a label that highlights perceived concerns about a product or warns consumers to avoid consumption of certain ingredients or substances present in our products. For example, in California, Proposition 65 requires a specific warning on any product that contains a substance listed by the State of California as having been found to cause cancer or birth defects, unless the level of such substance in the product is below a safe harbor level.
In addition, the United States has imposed new nutrition labeling regulations that require food manufacturers to declare the quantity of added sugar, as well as update serving sizes and labeling requirements for certain package sizes. As we transition our packaging to comply with the proposed January 1, 2020 compliance deadline, our new product labeling may impact the consumption and public perception of our products.
The imposition or proposed imposition of additional product labeling or warning requirements could reduce overall consumption of our products, lead to negative publicity (whether based in scientific fact or not) or leave consumers with the perception (whether or not valid) that our products do not meet their health and wellness needs. Such factors could adversely affect our business and operating results.
Changes in laws, regulations or rules, or a failure to comply with any laws, regulations or rules, may adversely affect our business, investments and results of operations.
We are subject to laws, regulations and rules enacted by national, regional and local governments and NASDAQ. In particular, we are required to comply with certain SEC, NASDAQ and other legal or regulatory requirements. Compliance with, and monitoring of, applicable laws, regulations and rules may be difficult, time consuming and costly. Those laws, regulations or rules and their interpretation and application may also change from time to time and those changes could have a material adverse effect on our business and operating results. A failure to comply with applicable laws, regulations or rules, as interpreted and applied, could have a material adverse effect on our business and operating results.
Unanticipated changes in effective tax rates or adverse outcomes resulting from examination of our income or other tax returns could adversely affect our financial condition and results of operations.
We are subject to income taxes in the United States, and our domestic tax liabilities will be subject to the allocation of expenses in differing jurisdictions. Our future effective tax rates could be subject to volatility or adversely affected by a number of factors, including:
•changes in the valuation of our deferred tax assets and liabilities;
•expected timing and amount of the release of any tax valuation allowances;
•tax effects of stock-based compensation;
•costs related to intercompany restructurings;
•changes in tax laws, regulations or interpretations thereof; and
| |
• | lower than anticipated future earnings in jurisdictions where we have lower statutory tax rates and higher than anticipated future earnings in jurisdictions where we have higher statutory tax rates. |
In addition, we may be subject to audits of our income, sales and other transaction taxes by United States federal and state authorities. Outcomes from these audits could have an adverse effect on our financial condition and results of operations.
A material impairment in the carrying value of acquired goodwill or other intangible assets could negatively affect our consolidated operating results and net worth.
A significant portion of our assets is goodwill and other intangible assets, the majority of which are not amortized but are reviewed for impairment at least annually and more often if indicators of impairment exist. At December 31, 2018, the carrying value of goodwill and other intangible assets totaled $2.5 billion, compared to total assets of $3.0 billion and total stockholders’ equity of $1.2 billion. If the carrying value of these assets exceeds the current estimated fair value, the asset is considered impaired, and this would result in a noncash charge to earnings, which could be material. Events and conditions that could result in impairment include a sustained drop in the market price of our Class A common stock, increased competition or loss of market share, obsolescence, product claims that result in a significant loss of sales or profitability over the product life, deterioration in macroeconomic conditions, or declining financial performance in comparison to projected results.
Our business operations could be disrupted if our information technology systems fail to perform adequately.
The efficient operation of our business depends on our information technology systems, most of which are managed by third-party service providers. We rely on our information technology systems to effectively manage our business data, communications, supply chain, order entry and fulfillment, and other business processes. The failure of our information technology systems to perform as we anticipate could disrupt our business and could result in transaction
errors, processing inefficiencies, and the loss of sales and customers, causing our business and operating results to suffer. In addition, our information technology systems may be vulnerable to damage or interruption from circumstances beyond our control, including fire, natural disasters, power outages, systems failures, security breaches, cyber-attacks and viruses. Any such damage or interruption could have a material adverse effect on our business.
We may be unable to hire or retain and develop key personnel or a highly skilled and diverse workforce or manage changes in our workforce.
We must hire, retain and develop a highly skilled and diverse workforce. We compete to hire new personnel in the many regions in which we manufacture and market our products and then to develop and retain their skills and competencies. Unplanned turnover or failure to develop adequate succession plans for leadership positions or hire and retain a diverse workforce with the skills and in the locations we need to operate and grow our business could deplete our institutional knowledge base and erode our competitiveness.
We also face increased personnel-related risks. These risks could lead to operational challenges, including increased competition for employees with the skills we require to achieve our business goals, and higher employee turnover, including employees with key capabilities. Furthermore, we might be unable to manage changes in, or that affect, our workforce appropriately or satisfy the legal requirements associated with how we manage and compensate our employees. These risks could materially and adversely affect our reputation, ability to meet the needs of our customers, product sales, financial condition and operating results.
Risks Related to Our Capital Structure
Our substantial leverage could adversely affect our ability to raise additional capital to fund our operations, limit our ability to react to changes in the economy or our industry, expose us to interest rate risk to the extent of our variable rate debt, and prevent us from meeting our obligations under our indebtedness.
We are highly leveraged. As of December 31, 2018, our total balance on long term debt, excluding deferred financing charges, discount, premium, and capital lease obligations, was approximately $983.8 million. Our high degree of leverage could have important consequences, including:
| |
• | requiring a substantial portion of cash flow from operations to be dedicated to the payment of principal and interest on our indebtedness, thereby reducing our ability to use our cash flow to fund our operations, capital expenditures, and future business opportunities or to pay dividends; |
| |
• | exposing us to the risk of increased interest rates because the portion of our borrowings not hedged by swap agreements are subject to variable rates; |
| |
• | making it more difficult for us to make payments on our indebtedness; |
| |
• | increasing our vulnerability to general economic and industry conditions; |
| |
• | restricting us from making strategic acquisitions or causing us to make non-strategic divestitures; |
| |
• | subjecting us to restrictive covenants that may limit our flexibility in operating our business; |
| |
• | limiting our ability to obtain additional financing for working capital, capital expenditures, product development, debt service requirements, acquisitions, and general corporate or other purposes; and |
| |
• | placing us at a competitive disadvantage compared to our competitors who are less highly leveraged. |
Despite our significant leverage, we may be able to incur significant additional amounts of debt, which could further exacerbate the risks associated with our significant leverage.
We may be unable to obtain additional financing to fund our operations and growth.
We may require additional financing to fund our operations or growth. The failure to secure additional financing could have a material adverse effect on our continued development or growth. None of our officers, directors or stockholders are required to provide any financing to us.
The Metropoulos Entities have significant influence over us.
As of February 22, 2019, the Metropoulos Entities beneficially own approximately 24% of our common stock, including 100% of our Class B common stock. Holders of our Class B stock are entitled to vote on all matters presented to the Company’s stockholders, but do not have any economic rights to the distributions of the Company. As long as the Metropoulos Entities own or control a significant percentage of our outstanding voting power, they will have the ability to significantly influence all corporate actions requiring stockholder approval, including the election and removal of directors and the size of our board, certain amendments to our certificate of incorporation or bylaws, or the approval of any merger or other significant corporate transaction, including a sale of substantially all of our assets.
The Metropoulos Entities’ interests may not align with the interests of our other stockholders. The Metropoulos Entities are in the business of making investments in companies and may acquire and hold interests in businesses that compete directly or indirectly with us. The Metropoulos Entities may also pursue acquisition opportunities that may be complementary to our business.
We are required to pay the Tax Receivable Agreement counterparties for a significant portion of the tax benefit relating to any additional tax depreciation or amortization deductions we claim as a result of any step up in the tax basis of the assets of our operating subsidiaries resulting from the Metropoulos Entities’ exchange of shares of Class B common stock and Class B units of Hostess Holdings for shares of our Class A common stock.
Class B units in Hostess Holdings may be exchanged (together with the cancellation of shares of our Class B common stock) by the holders thereof for, at the Company’s election, shares of Class A common stock, on a one-for-one basis (subject to customary anti-dilution adjustments), or the cash equivalent of such shares. The exchanges may result in increases to our share of the tax basis of the tangible and intangible assets of our operating subsidiaries that otherwise would not have been available, although the United States Internal Revenue Service may challenge all or part of that tax basis increase, and a court could sustain such a challenge by the United States Internal Revenue Service. These increases in tax basis, if sustained, may reduce the amount of tax that we would otherwise be required to pay in the future.
We are party to a Tax Receivable Agreement that provides for the payment by us of approximately 85% of the net cash savings, if any, in United States federal, state and local income tax that the Company actually realizes (or is deemed to realize in certain circumstances) as a result of: (i) certain increases in tax basis resulting from the Hostess Business Combination; (ii) certain tax attributes of Hostess Holdings and its subsidiaries existing prior to the Hostess Business Combination and prior to subsequent exchanges of Class B units; (iii) certain increases in tax basis resulting from exchanges of Class B units; (iv) imputed interest deemed to be paid by the Company as a result of payments that it makes under the Tax Receivable Agreement; and (v) certain increases in tax basis resulting from payments that the Company makes under the Tax Receivable Agreement.
In January 2018, in exchange for $34.0 million, the Apollo Funds agreed to terminate their rights to all future payment obligations under the Tax Receivable Agreement. As a result, the Company will retain a greater portion of the net cash tax savings derived from the tax attributes subject to the Tax Receivable Agreement.
If our dividend policy is materially different than the distribution policy of Hostess Holdings, upon the exchange of any Class B units, the limited partners of Hostess Holdings could receive a disproportionate interest in the aggregate distributions by our operating subsidiaries that have not been distributed by us.
We and the Metropoulos Entities are limited partners of Hostess Holdings. To the extent Hostess Holdings distributes to its limited partners a greater share of income received from our operating subsidiaries than we distribute to our stockholders, then any of the Metropoulos Entities who participate in such distribution by Hostess Holdings and subsequently exercise their rights to exchange limited partnership units in Hostess Holdings for Class A common stock may receive a disproportionate interest in the aggregate distributions by our operating subsidiaries that have not been distributed by us. The reason is that such Metropoulos Entity could receive both (i) the benefit of a distribution by Hostess Holdings to its limited partners, including such Metropoulos Entity, and (ii) the benefit of a distribution by the Company to the holders of Class A common stock, including such Metropoulos Entity. Consequently, if our dividend policy does not match the distribution policy of Hostess Holdings, other holders of Class A common stock as of the date of an exchange could experience a reduction in their interest in the profits previously distributed by our operating
subsidiaries that have not been distributed by us. Our current dividend policy could result in distributions to our common stockholders that are different from the distributions made by Hostess Holdings to its limited partners.
Our only significant asset is our ownership interest in our operating subsidiaries and such ownership may not be sufficient to pay dividends or make distributions or loans to enable us to pay any dividends on our common stock or satisfy our other financial obligations, including our obligations under the Tax Receivable Agreement.
We have no direct operations and no significant assets other than our ownership interest in our operating subsidiaries. We depend on our operating subsidiaries for distributions, loans and other payments to generate the funds necessary to meet our financial obligations, including our expenses as a publicly traded company, to pay any dividends with respect to our common stock, and to satisfy our obligations under the Tax Receivable Agreement. The financial condition and operating requirements of our operating subsidiaries may limit our ability to obtain cash from our operating subsidiaries. The earnings from, or other available assets of, our operating subsidiaries may not be sufficient to pay dividends or make distributions or loans to enable us to pay any dividends on our common stock or satisfy our other financial obligations, including our obligations under the Tax Receivable Agreement.
The ability of our operating subsidiaries (other than subsidiaries which have been designated as unrestricted pursuant to our ability to do so in certain limited circumstances) to make distributions, loans and other payments to us for the purposes described above and for any other purpose are governed by the terms of our credit facilities and will be subject to the negative covenants set forth therein. Any loans or other extensions of credit will be subject to the investment covenants contained therein, which provide for several exceptions including, among others (i) a general investment basket equal to the greater of a fixed dollar amount and a percentage of EBITDA and (ii) an unlimited investment basket based on satisfying a total net leverage ratio on a pro forma basis. Similarly, any dividends, distributions or similar payments will be subject to the dividends and distributions covenant under such credit facilities, which also provide for several exceptions including, among others (i) for payment of overhead and certain fees and expenses of parent companies, (ii) for tax distributions, subject to certain limitations, (iii) a general dividend and distribution basket equal to the greater of a fixed dollar amount and a percentage of EBITDA and (iv) an unlimited dividend and distribution basket based on satisfying a total net leverage ratio on a pro forma basis.
Risks Related to Our Class A Common Stock
Resales of the shares of Class A common stock could depress the market price of our Class A common stock.
There may be a large number of shares of Class A common stock sold in the market in the near future. These sales, or the perception in the market that the holders of a large number of shares intend to sell shares, could reduce the market price of our Class A common stock. As of February 22, 2019, the Metropoulos Entities held approximately 24% of our Common Stock, including 100% of our Class B common stock. All such shares of Class A common stock held by or obtainable in exchange for Class B common stock and Class B units held by the Metropoulos Entities have been registered for resale under the Securities Act pursuant to a shelf registration statement filed in 2016.
We have approximately 100,046,392 shares of Class A common stock outstanding as of February 22, 2019. There are also remaining registered shares of Class A common stock that we may issue under the Hostess Brands, Inc. 2016 Equity Incentive Plan, which shares may be freely sold in the public market upon issuance, subject to compliance with stock ownership guidelines and volume limitations applicable to affiliates.
In addition, as of December 31, 2018, there were 48,274,307 public warrants and 8,225,583 private warrants outstanding. Each warrant entitles its holder to purchase one half of one share of our Class A common stock at an exercise price of $5.75 per half share, to be exercised only for a whole number of shares of our Class A common stock.
Such sales of shares of Class A common stock or the perception of such sales may depress the market price of our Class A common stock.
A market for our securities may not continue, which would adversely affect the liquidity and price of our securities.
The price of our securities may fluctuate significantly due to general market and economic conditions. An active trading market for our securities may not be sustained. In addition, the price of our securities can vary due to general economic conditions and forecasts, our general business condition and the release of our financial reports. Additionally, if our securities become delisted from NASDAQ for any reason, and are quoted on the OTC Bulletin Board, an inter-dealer automated quotation system for equity securities that is not a national securities exchange, the liquidity and price of our securities may be more limited than if we were quoted or listed on NASDAQ or another national securities exchange. You may be unable to sell your securities unless a market can be established or sustained.
If securities or industry analysts cease publishing research or reports about us, our business, or our market, or if they change their recommendations regarding our Class A common stock adversely, then the price and trading volume of our Class A common stock could decline.
The trading market for our Class A common stock will be influenced by the research and reports that industry or securities analysts may publish about us, our business, our market, or our competitors. Securities and industry analysts may cease to publish research on us. If any of the analysts who may cover us change their recommendation regarding our stock adversely, or provide more favorable relative recommendations about our competitors, the price of our Class A common stock would likely decline. If any analyst who may cover us were to cease coverage of us or fail to regularly publish reports on it, we could lose visibility in the financial markets, which could cause our stock price or trading volume to decline.
If we fail to maintain an effective system of internal controls, we may not be able to accurately report our financial results.
We are required to comply with Section 404 of the Sarbanes Oxley Act, which requires, among other things, that companies maintain disclosure controls and procedures to ensure timely disclosure of material information, and that management review the effectiveness of those controls on a quarterly basis. Effective internal controls are necessary for us to provide reliable financial reports and to help prevent fraud, and our management and other personnel devote a substantial amount of time to these compliance requirements. Moreover, these rules and regulations increased our legal and financial compliance costs and make some activities more time-consuming and costly. We cannot be certain that we will be able to maintain adequate controls over our financial processes and reporting in the future or that we will be able to comply with our obligations under Section 404 of the Sarbanes Oxley Act. Section 404 of the Sarbanes Oxley Act also requires us to evaluate annually the effectiveness of our internal controls over financial reporting as of the end of each fiscal year and to include a management report assessing the effectiveness of our internal control over financial reporting in our Annual Report on Form 10-K. If we fail to maintain the adequacy of our internal controls, we cannot assure you that we will be able to conclude in the future that we have effective internal control over financial reporting and/or we may encounter difficulties in implementing or improving our internal controls, which could harm our operating results or cause us to fail to meet our reporting obligations. If we fail to maintain effective internal controls, we might be subject to sanctions or investigation by regulatory authorities, such as the SEC. Any such action could adversely affect our financial results and may also result in delayed filings with the SEC.
Our quarterly operating results may fluctuate significantly and could fall below the expectations of securities analysts and investors due to seasonality and other factors, some of which are beyond our control, resulting in a decline in our stock price.
Our quarterly operating results may fluctuate significantly because of seasonality and several other factors, including:
| |
• | labor availability and costs for hourly and management personnel; |
| |
• | profitability of our products, especially in new markets and due to seasonal fluctuations; |
| |
• | changes in interest rates; |
| |
• | impairment of long-lived assets; |
| |
• | macroeconomic conditions, both nationally and locally; |
| |
• | disruption in production by us or a co-manufacturer; |
| |
• | negative publicity relating to products we sell; |
| |
• | changes in consumer preferences and competitive conditions; |
| |
• | expansion to new markets; |
| |
• | fluctuations in commodity prices; and |
| |
• | actions by our competitors (e.g., pricing promotions). |
Fluctuations in our operating results due to the foregoing or other factors could cause our results to fall below the expectations of securities analysts and investors, resulting in a decline in our stock price.
Anti-takeover provisions contained in our certificate of incorporation and bylaws, as well as provisions of Delaware law, could impair a takeover attempt.
Our certificate of incorporation contains provisions that may discourage unsolicited takeover proposals that stockholders may consider to be in their best interests. We are also subject to anti-takeover provisions under Delaware law, which could delay or prevent a change of control. Together, these provisions may make more difficult the removal of management and may discourage transactions that otherwise could involve payment of a premium over prevailing market prices for our securities. These provisions include:
| |
• | a staggered board providing for three classes of directors, which limits the ability of a stockholder or group to gain control of our board; |
| |
• | no cumulative voting in the election of directors, which limits the ability of minority stockholders to elect director candidates; |
| |
• | the right of our board to elect a director to fill a vacancy created by the expansion of our board or the resignation, death or removal of a director in certain circumstances, which prevents stockholders from being able to fill vacancies on our board; |
| |
• | a prohibition on stockholder action by written consent, which forces stockholder action to be taken at an annual or special meeting of our stockholders; |
| |
• | a prohibition on stockholders calling a special meeting and the requirement that a meeting of stockholders may only be called by members of our board, which may delay the ability of our stockholders to force consideration of a proposal or to take action, including the removal of directors; |
| |
• | the requirement that changes or amendments to certain provisions of our certificate of incorporation or bylaws must be approved by holders of at least two-thirds of our common stock; and |
| |
• | advance notice procedures that stockholders must comply with in order to nominate candidates to our board or to propose matters to be acted upon at a meeting of stockholders, which may discourage or deter a potential acquirer from conducting a solicitation of proxies to elect the acquirer’s own slate of directors or otherwise attempting to obtain control of us. |
Item 1B. Unresolved Staff Comments
None.
Item 2. Properties.
As of December 31, 2018, we operated six bakeries and five distribution centers and occupied a corporate headquarters, as shown in the chart below.
|
| | | | | |
Type | Location | Owned/Leased | Size (Sq. Ft.) | Segment |
Bakery | Emporia, Kansas | Owned | 278,500 |
| SBG |
Bakery | Columbus, Georgia | Leased(1) | 313,700 |
| SBG |
Bakery | Indianapolis, Indiana | Owned | 195,000 |
| SBG |
Bakery | Chicago, Illinois | Owned | 137,000 |
| SBG |
Bakery | Southbridge, Massachusetts | Owned | 37,850 |
| ISB |
Bakery | Southbridge, Massachusetts | Leased | 47,640 |
| ISB |
Distribution Center | Chicago, Illinois | Leased | 64,816 |
| SBG |
Distribution Center | Chicago, Illinois | Other(2) | — |
| SBG/ISB |
Distribution Center | Shorewood, Illinois | Leased | 507,187 |
| SBG |
Distribution Center | Carthage, Missouri | Other(2) | — |
| SBG/ISB |
Distribution Center | Hobart, Indiana | Other(2) | — |
| SBG/ISB |
Corporate Headquarters | Kansas City, Missouri | Leased | 40,450 |
| SBG/ISB |
(1) The Columbus, GA facility is available for the purchase amount of $100.
(2) Variable fees related to the third-party distribution center include storage and pallet-related charges.
Item 3. Legal Proceedings
We are involved in lawsuits, claims and proceedings arising in the ordinary course of business. These matters may involve personnel and employment issues, personal injury, contract and other proceedings arising in the ordinary course of business, which have not resulted in any material losses to date. Although we do not expect the outcome of these proceedings to have a material adverse effect on our financial condition or results of operations, litigation is inherently unpredictable. Therefore, we could incur judgments or enter into settlements or claims that could materially impact our results.
The information required to be furnished by us under this Part I, Item 3 (Legal Proceedings) is incorporated by reference to the information contained in Note 14--Commitments and Contingencies to the consolidated financial statements included in Part II, Item 8 on this Annual Report on Form 10-K.
Item 4. Mine Safety Disclosures.
Not applicable.
PART II
Item 5. Market for Registrant’s Common Equity, Related Stockholder Matters and Issuer Purchases of Equity Securities
Our Class A common stock and warrants are currently quoted on NASDAQ under the symbols “TWNK” and “TWNKW,” respectively.
As of February 22, 2019, there were approximately 8 stockholders of record of our Class A common stock and one stockholder of record of our Class B common stock.
We currently do not pay dividends and have not paid any cash dividends on our common stock to date.
Securities Authorized for Issuance Under Equity Compensation Plans
|
| | | | | | | | | | | | |
Plan Category | | (A) Number of Securities to be Issued Upon Exercise of Outstanding Options, Warrants and Rights | | (B) Weighted Average Exercise Price of Outstanding Options, Warrants, and Rights | | (C) Number of Securities Remaining Available for Future Issuance Under Equity Compensation Plan (excluding securities reflected in column (A)) | |
Equity Compensation Plans approved by stockholders | | 1,875,464 |
| (1) | $ | 14.96 |
| (2 | ) | 4,748,036 |
| (3) |
Equity Compensation Plans not approved by stockholders | | — |
| | — | | — |
| |
Total | | 1,875,464 |
| | $ | 14.96 |
| | 4,748,036 |
| |
| |
(1) | Consists of shares subject to outstanding stock options, restricted stock units and performance restricted stock units under the Hostess Brands, Inc. 2016 Equity Incentive Plan (the “2016 Plan”), some of which are vested and some of which remain subject to the vesting and/or performance criteria relating to the respective equity award. |
| |
(2) | Represents the weighted average exercise price of 943,939 stock options and excludes the impact of 931,525 shares of restricted stock units for which no exercise price is payable |
| |
(3) | Consists of shares available for future issuance under the 2016 Plan. |
For additional information, refer to Item 12 of Part III of this Annual Report on Form 10-K.
Unregistered Sales of Equity Securities and Use of Proceeds
The Metropoulos Entities may exchange the Class B units in Hostess Holdings, together with shares of Class B common stock for share of our Class A common stock on a one-for-one basis. Other than any shares of Class A common stock executed on such exchanges, we did not issue any equity securities without registration during the period covered by this annual report on Form 10-K.
Issuer Purchase of Equity Securities
The Company did not have any repurchases of common stock for the year ended December 31, 2018.
Warrants
As of December 31, 2018, there were 48,274,307 public warrants and 8,225,583 private warrants outstanding. Each warrant entitles its holder to purchase one half of one share of our Class A common stock at an exercise price of $5.75 per half share, to be exercised only for a whole number of shares of our Class A common stock. The warrants became exercisable on December 4, 2016 and expire five years after that date or earlier upon redemption or liquidation. The Company may redeem the outstanding public warrants at a price $0.01 per warrant, if the last sale price of the Company’s common stock equals or exceeds $24.00 per share for any 20 trading days within a 30 trading day period ending on the third business day before the Company sends the notice of redemption to the warrant holders. The private placement warrants, however, are nonredeemable so long as they are held by Gores Sponsor, LLC or its permitted transferees. The private warrants were registered with the SEC for future potential sales to the public. When sold to the public, the private placement warrants will become public warrants.
Performance Graph
The following graph and related information shall not be deemed “soliciting material” or be deemed to be “filed” with the Commission, nor shall such information be incorporated by reference into any future filing, except to the extent that we specifically incorporate it by reference into such filing.The following stock performance graph compares, for the period November 30, 2015 (the first day our common stock was traded following our initial public offering) through December 31, 2018 (the last trading day of our fiscal year), the cumulative total stockholder return for (1) the Company’s common stock, (2) the Standard & Poor’s 500 and (3) the Standard & Poor’s 500 Packaged Foods and Meats Index. The graph assumes the value of the investment in our common stock and each index was $100.00 on November 30, 2015 and assumes reinvestment of any dividends.The stock price performance below is not necessarily indicative of future stock price performance.
Item 6. Selected Financial Data
The following table sets forth selected consolidated financial data for the last five years. The selected consolidated financial data should be read in conjunction with Item 7. Management’s Discussion and Analysis of Financial Condition and Results of Operations and Item 8. Financial Statements and Supplementary Data.
As a result of the completion of the Hostess Business Combination on November 4, 2016, our selected financial data below are presented: as “2018” for December 31, 2018 or for the year ended December 31, 2018 (Successor); as “2017” for December 31, 2017 or for the year ended December 31, 2017 (Successor); as “2016” for December 31, 2016 or for the period November 4, 2016 to December 31, 2016 (Successor); “2016” for the period January 1, 2016 to November 3, 2016 (Predecessor); as “2015” for December 31, 2015 or for the year ended December 31, 2015 (Predecessor); as “2014” for December 31, 2014 and for the year ended December 31, 2014.
As a result of the Hostess Business Combination, we are the acquirer for accounting purposes and Hostess Holdings is the acquiree and accounting predecessor. Our financial statement presentation includes the financial statements of Hostess Holdings as “Predecessor” for periods prior to the Closing Date and “Successor” for periods after the Closing Date, including the consolidation of Hostess Holdings.
|
| | | | | | | | | | | | | | | | | | | | | | | | |
(In thousands except for per share data) | 2018 (1) | | 2017 (2) | | 2016 (3) | | 2015 | | 2014 |
| (Successor) | | (Successor) | | (Successor) | | | (Predecessor) | | (Predecessor) | | (Predecessor) |
Statement of operations: | | | | | | | | | | | | |
Net revenue | $ | 850,389 |
| | $ | 776,188 |
| | $ | 111,998 |
| | | $ | 615,588 |
| | $ | 620,815 |
| | $ | 554,695 |
|
Gross profit | 267,277 |
| | 326,898 |
| | 38,714 |
| | | 266,529 |
| | 262,203 |
| | 233,932 |
|
Net income (loss) | 81,426 |
| | 258,108 |
| | (8,485 | ) | | | 60,425 |
| | 88,760 |
| | 81,464 |
|
Net income (loss) per basic Class A share (4) | 0.63 |
| | 2.26 |
| | (0.05 | ) | | | | | | | |
Net income (loss) per diluted Class A share (4) | 0.61 |
| | 2.13 |
| | (0.05 | ) | | | | | | | |
Balance sheet: | | | | | | | | | | | | |
Total assets | 3,010,713 |
| | 2,966,275 |
| | 2,847,892 |
| | | 643,529 |
| | 765,494 |
| | 683,678 |
|
Long-term debt and capital leases obligations | 988,004 |
| | 999,188 |
| | 993,374 |
| | | 1,193,667 |
| | 473,175 |
| | 479,602 |
|
Liquidity: | | | | | | | | | | | | |
Capital expenditures (5) | 53,748 |
| | 36,383 |
| | 7,627 |
| | | 31,477 |
| | 27,267 |
| | 54,728 |
|
Notes to the selected financial data:
| |
1. | During the year ended December 31, 2018, we entered into an agreement to buyout a counterparty’s rights to all current and future tax savings under the tax receivable agreement entered into in connection with the Hostess Business Combination (the “Tax Receivable Agreement”) in exchange for a $34.0 million cash payment, resulting in a gain of $12.4 million. We also acquired the Cloverhill Business in February 2018. |
| |
2. | During the year ended December 31, 2017, we recognized a gain of $161.5 million related to the remeasurement of deferred tax items and the Tax Receivable Agreement primarily due to enacted tax laws referred to as “Tax Reform”. |
| |
3. | 2016 Predecessor and Successor financial results reflect certain transactions related to the Hostess Business Combination, including business combination costs of $31.8 million in the Predecessor Period and stock compensation expense of $26.4 million in the Successor Period. We also completed the acquisition of Superior in May of 2016. |
| |
4. | Earnings per basic and diluted share is not presented for the Predecessor, which is a partnership. |
| |
5. | Capital expenditures consists of purchases of property and equipment and acquisition and development of software assets paid in cash or accrued during the period. |
RECONCILIATION OF NON-GAAP FINANCIAL MEASURES
Adjusted gross profit, adjusted gross margin, adjusted EBITDA, adjusted net income attributed to Class A stockholders and adjusted EPS are non-GAAP financial measures commonly used in the Company's industry and should not be construed as an alternative to gross profit, net income or earnings per share as indicators of operating performance or as alternatives to cash provided by operating activities as a measure of liquidity (each as determined in accordance with GAAP). These measures may not be comparable to similarly titled measures reported by other companies. The Company has included these measures because it believes the measures provide management and investors with additional information to measure the Company's performance and liquidity, estimate the Company's value and evaluate the Company's ability to service debt.
Adjusted Gross Profit and Adjusted Gross Margin
Gross profit and gross margin are adjusted to exclude certain items that affect comparability. The adjustments are itemized below. You are encouraged to evaluate these adjustments and the reason the Company considers them appropriate for supplemental analysis.
Adjusted EBITDA
The Company defines adjusted EBITDA as net income adjusted to exclude (i) interest expense, net, (ii) depreciation and amortization and (iii) income taxes, as further adjusted to eliminate the impact of certain items that the Company does not consider indicative of its ongoing operating performance. These further adjustments are itemized below. You are encouraged to evaluate these adjustments and the reasons the Company considers them appropriate for supplemental analysis.
Adjusted EBITDA has limitations as an analytical tool, and you should not consider it in isolation, or as a substitute for analysis of the Company's results as reported under GAAP. For example, adjusted EBITDA:
| |
• | does not reflect the Company's capital expenditures, future requirements for capital expenditures or contractual commitments; |
| |
• | does not reflect changes in, or cash requirements for, the Company's working capital needs; |
| |
• | does not reflect the significant interest expense, or the cash requirements necessary to service interest or principal payments, on the Company's debt; and |
| |
• | does not reflect payments related to income taxes, the Tax Receivable Agreement or distributions to the non-controlling interest to reimburse its tax liability. |
Adjusted Net Income attributed to Class A stockholders and Adjusted EPS
Net income attributed to Class A stockholders is adjusted to exclude certain items that the Company does not consider indicative of its ongoing operating performance, then divided by weighted average diluted Class A shares outstanding to determine adjusted EPS. The adjustments are itemized below. Adjusted EPS is only presented for the periods subsequent to the Hostess Business Combination since the Predecessor was a partnership. You are encouraged to evaluate these adjustments and the reasons the Company considers them appropriate for supplemental analysis.
|
| | | | | | | | | | | | | | | | | | | | | | | | |
(In thousands) | 2018 | | 2017 | | 2016 | | 2015 | | 2014 |
| (Successor) | | (Successor) | | (Successor) | | | (Predecessor) | | (Predecessor) | | (Predecessor) |
Reconciliation of Adjusted Gross Profit | | | | | | | | | | | | |
Gross profit | $ | 267,277 |
| | $ | 326,898 |
| | $ | 38,714 |
| | | $ | 266,529 |
| | $ | 262,203 |
| | $ | 233,932 |
|
Non-GAAP adjustments: | | | | | | | | | | | | |
Acquisition and integration costs | 10,137 |
| | — |
| | 8,914 |
| | | — |
| | — |
| | — |
|
Special employee incentive compensation | 1,965 |
| | — |
| | — |
| | | 2,195 |
| | 2,649 |
| | — |
|
Adjusted gross profit | $ | 279,379 |
| | $ | 326,898 |
| | $ | 47,628 |
| | | $ | 268,724 |
| | $ | 264,852 |
| | $ | 233,932 |
|
| | | | | | | | | | | | |
Adjusted gross margin | 32.9 | % | | 42.1 | % | | 42.5 | % | | | 43.7 | % | | 42.7 | % | | 42.2 | % |
| | | | | | | | | | | | |
Reconciliation of Adjusted EBITDA | | | | | | | | | | | | |
Net income | $ | 81,426 |
| | $ | 258,108 |
| | $ | (8,485 | ) | | | $ | 60,425 |
| | $ | 88,760 |
| | $ | 81,464 |
|
Non-GAAP adjustments: | | | | | | | | | | | | |
Income tax provision | 12,954 |
| | (67,204 | ) | | (7,762 | ) | | | 439 |
| | — |
| | — |
|
Interest expense, net | 39,404 |
| | 39,174 |
| | 6,649 |
| | | 60,384 |
| | 50,011 |
| | 37,447 |
|
Depreciation and amortization | 41,411 |
| | 38,170 |
| | 5,843 |
| | | 10,265 |
| | 9,836 |
| | 7,113 |
|
Share-based compensation | 5,600 |
| | 7,413 |
| | 26,748 |
| | | 3,890 |
| | 1,381 |
| | 372 |
|
Tax Receivable Agreement remeasurement and gain on buyout | (14,237 | ) | | (50,222 | ) | | — |
| | | — |
| | — |
| | — |
|
Impairment of property and equipment, intangible assets and goodwill | 4,717 |
| | 1,003 |
| | — |
| | | 7,300 |
| | 2,700 |
| | 13,241 |
|
Special employee incentive compensation | 3,444 |
| | — |
| | — |
| | | 4,698 |
| | 3,923 |
| | — |
|
Acquisition and integration costs | 10,434 |
| | — |
| | 8,914 |
| | | 31,832 |
| | — |
| | — |
|
Loss (gain) on debt modification | — |
| | 2,554 |
| | (763 | ) | | | | | 25,880 |
| | — |
|
Loss (gain) on sale/abandonment of property and equipment and bakery shutdown costs (recoveries) | 253 |
| | (144 | ) | | — |
| | | 2,551 |
| | 4,182 |
| | 5,150 |
|
Other | 770 |
| | 1,360 |
| | 751 |
| | | 1,624 |
| | (8,743 | ) | | 556 |
|
Adjusted EBITDA | $ | 186,176 |
| | $ | 230,212 |
| | $ | 31,895 |
| | | $ | 183,408 |
| | $ | 177,930 |
| | $ | 145,343 |
|
i. For the year ended December 31, 2018, other expenses included transaction and other non-operating professional fees. For the year ended December 31, 2017, other expense primarily included professional fees incurred related to the secondary public offering of common stock and the registration of certain privately held warrants offset by a gain recognized related to the modification of long-term debt.
|
| | | | | | | | | | | |
(In thousands, except share and per share data) | 2018 | | 2017 | | 2016 |
Reconciliation of Adjusted EPS | (Successor) | | (Successor) | | (Successor) |
Net income (loss) attributed to Class A stockholders | $ | 62,895 |
| | $ | 223,897 |
| | $ | (4,404 | ) |
Non-GAAP adjustments: | | | | | |
Tax Receivable Agreement remeasurement and gain on buyout | (14,237 | ) | | (50,222 | ) | | — |
|
Executive chairman agreement termination and execution | — |
| | — |
| | 26,748 |
|
Remeasurement of deferred taxes | (5,375 | ) | | (108,621 | ) | | — |
|
Impairment of property and equipment, intangible assets and goodwill | 4,717 |
| | 1,003 |
| | — |
|
Special employee incentive compensation | 3,444 |
| | — |
| | — |
|
Acquisition and integration costs | 10,434 |
| | — |
| | 8,914 |
|
Loss (gain) on debt modification | — |
| | 2,554 |
| | (763 | ) |
Loss (gain) on sale/abandonment of property and equipment and bakery shutdown costs (recoveries) | 253 |
| | (144 | ) | | — |
|
Tax impact of adjustments | (2,027 | ) | | (717 | ) | | (10,470 | ) |
Non-controlling interest allocation of adjustments | (4,343 | ) | | (1,077 | ) | | (9,772 | ) |
Adjusted Net income attributed to Class A stockholders | $ | 55,761 |
| | $ | 66,673 |
| | $ | 10,253 |
|
Weighted average Class A shares outstanding-diluted | 103,098,394 |
| | 105,307,293 |
| | 97,791,658 |
|
Adjusted EPS | $ | 0.54 |
| | $ | 0.63 |
| | $ | 0.10 |
|
Item 7. Management’s Discussion and Analysis of Financial Condition and Results of Operations
The following discussion and analysis of our financial condition and results of operations should be read in conjunction with our consolidated financial statements and related notes included in Item 8 of this Annual Report on Form 10-K. This discussion contains forward-looking statements that involve risks and uncertainties. Our actual results could differ materially from those discussed below. Factors that could cause or contribute to such differences include, but are not limited to, those identified below and those discussed in Item 1A “Risk Factors” of this Annual Report on Form 10-K.
Overview
We are a leading United States packaged food company focused on developing, manufacturing, marketing, selling and distributing fresh sweet baked goods coast-to-coast, providing a wide range of snack cakes, donuts, sweet rolls, breakfast pastries, snack pies and related products. As of December 31, 2018, we operate six baking facilities and five primary distribution centers. Our DTW product distribution system allows us to deliver to our customers’ warehouses. Our customers in turn distribute to their retail stores and/or distributors.
We have two reportable segments: “Sweet Baked Goods” and “In-Store Bakery”. Sweet Baked Goods consists of fresh and frozen sweet baked goods and bread products sold under the Hostess®, Dolly Madison®, Cloverhill®, and Big Texas® brands along with store branded products. In-Store Bakery consists primarily of Superior on Main® branded eclairs, madeleines, brownies, and iced cookies sold in the bakery section of grocery and club stores.
Hostess® is the second leading brand by market share within the SBG category, according to Nielsen U.S. total universe. For the 52 week period ended December 29, 2018 our branded SBG products (which include Hostess®, Dolly Madison®, Cloverhill®, and Big Texas® ) market share was 18.0% per Nielsen’s U.S. SBG category data.
Principal Components of Operating Results
Net Revenue
We generate revenue primarily through selling sweet baked goods and other products under the Hostess® group of brands, which includes iconic products such as Twinkies®, CupCakes, Ding Dongs®, Zingers®, HoHos® and Donettes®. We also sell products under the Dolly Madison®, Superior on Main®, Cloverhill®and Big Texas® brands along with store branded products. Our product assortment is sold to customers’ warehouses and distribution centers by the case or in display ready corrugate units. Retailers display and sell our products to the end consumer in single-serve, multi-pack or club-pack formats. We sell our products primarily to supermarket chains, national mass merchandisers and convenience and drug stores, along with a smaller portion of our product sales going to dollar stores, vending, club, and other retail outlets.
Our revenues are driven by average net price and total volume of products sold. Factors that impact unit pricing and sales volume include product mix, the cost of ingredients, the promotional activities implemented by the Company and its competitors, industry capacity, new product initiatives and quality and consumer preferences. We do not keep a significant backlog of finished goods inventory, as our fresh baked products are promptly shipped to our distribution centers after being produced and then distributed to customers.
Cost of Goods Sold
Cost of goods sold consists of ingredients, packaging, labor, energy, other production costs, warehousing and transportation costs including in-bound freight, inter-plant transportation and distribution of our products to customers. The cost of ingredients and packaging represent the majority of our total costs of goods sold. All costs that are incurred at the bakeries, including the depreciation of bakery facilities and equipment, are included in cost of goods sold. We do not allocate any corporate functions into cost of goods sold.
Our cost of ingredients consists principally of flour, sweeteners, edible oils and cocoa, which are subject to substantial price fluctuations, as is the cost of paper, corrugate, films and plastics used to package our products. The prices for raw materials are influenced by a number of factors, including the weather, crop production, transportation and processing costs, government regulation and policies and worldwide market supply and demand. We also rely on fuel products, such as natural gas, diesel, propane and electricity, to operate our bakeries and produce our products. Fluctuations in the prices of the raw materials or fuel products used in the production, packaging or transportation of our products affect the cost of products sold and our product pricing strategy. We utilize forward buying strategies through short-term and long-term advance purchase contracts to lock in prices for certain high-volume raw materials, packaged components and certain fuel inputs. Through these initiatives, we believe we are able to obtain competitive pricing.
Advertising and Marketing
Our advertising and marketing expenses relate to our advertising campaigns, which include social media, print, online advertising, local promotional events and monthly agency fees. We also invest in wire and corrugate displays delivered to customers to display our products off shelf, field marketing and merchandising to reset and check the store inventory on a regular basis in addition to marketing employment costs.
Selling Expense
Selling expenses primarily include sales management, employment, travel, and related expenses, as well as broker fees. We utilize brokers for sales support, including managing promotional activities and order processing.
General and Administrative
General and administrative expenses primarily include employee and related expenses for the accounting, planning, customer service, legal, human resources, corporate operations, research and development, purchasing, logistics and executive functions. Also included are professional service fees related to audit and tax, legal, outsourced information technology functions, transportation planning, and corporate site and insurance costs, as well as the depreciation and amortization of corporate assets.
Non-Controlling Interest
Mr. Metropoulos and the Metropoulos Entities hold their equity investment in us primarily through Class B limited partnership units in the Company’s subsidiary, Hostess Holdings (“Class B Units”), and an equal number of shares of the Company’s Class B common stock (“Class B Stock”). Our Class B Stock has voting, but no economic rights, while Hostess Holdings’ Class B Units have economic, but no voting rights. Each Class B Unit, together with a share of Class B Stock held by the Metropoulos Entities, is exchangeable for a share of the Company’s Class A common stock (or at the option of the Company, the cash equivalent thereof). The Company holds 100% of the general partnership interest in Hostess Holdings and a majority of the limited partnership interests and consolidates Hostess Holdings in the Company’s consolidated financial statements. The interest of the Metropoulos Entities in Hostess Holdings’ Class B Units is reflected in our consolidated financial statements as a non-controlling interest.
For periods prior to the Hostess Business Combination, Hostess Holdings consolidated the financial position and results of operations of New Hostess Holdco, LLC. The portion of New Hostess Holdco, LLC not owned by Hostess Holdings (which constituted a profits interest plan for management) was recognized as a non-controlling interest in its consolidated financial statements.
Factors Impacting Recent Results
Acquisitions
On February 1, 2018, we acquired certain U.S. breakfast assets from Aryzta, LLC (Aryzta), which included a bakery, inventory, and the Big Texas® and Cloverhill® brand names (collectively referred to as the “Cloverhill Business”). We acquired these assets to expand our product portfolio and to gain previously outsourced manufacturing capabilities for our existing product portfolio. Our consolidated statement of operations includes the operation of these assets from February 1, 2018 through December 31, 2018. We evaluated the impact of the acquisition of the Cloverhill Business on our financial statements and concluded that the impact was not significant and did not require the inclusion of pro forma financial results assuming the acquisition had occurred on January 1, 2016.
Tax Receivable Agreement Buyout
On January 26, 2018, we entered into a transaction to terminate all future payments under the Tax Receivable Agreement payable to the Apollo Funds in exchange for a cash payment of $34.0 million, which was recognized as a financing outflow on the consolidated statement of cash flow. This transaction did not affect the portion of the rights under the Tax Receivable Agreement payable to the Metropoulos Entities. We recognized a $12.4 million gain in the non-operating section of our consolidated statement of operations, which represented the difference between the $46.4 million carrying value of the portion of the Tax Receivable Agreement liability which was terminated and the $34.0 million of cash payments.
Tax Reform
During the year ended December 31, 2017, the Tax Cuts and Jobs Act (“Tax Reform”) was signed into law. Tax Reform significantly changed U.S. tax law by lowering the corporate income tax rate permanently from a maximum of 35% to a flat 21% rate, effective January 1, 2018. This impacted the valuation of our tax items and the Tax Receivable Agreement.
Note on Financial Presentation
As a result of the completion of the Hostess Business Combination on November 4, 2016, our consolidated financial statements included elsewhere in this Annual Report are presented: (i) as of December 31, 2018 and for the year ended December 31, 2018 (Successor); (ii) as of December 31, 2017 and for the year ended December 31, 2017 (Successor); (iii) as of December 31, 2016 and for the period November 4, 2016 to December 31, 2016 (Successor); (iv) for the period January 1, 2016 to November 3, 2016 (Predecessor).
Results of Operations
Comparison of Results of Operations for the Year Ended December 31, 2018 (Successor), Year Ended December 31, 2017 (Successor), Period From November 4, 2016 through December 31, 2016 (Successor) (“2016 Successor Period”), and From January 1, 2016 through November 3, 2016 (Predecessor) (“2016 Predecessor Period”)
As discussed above, the financial information presented herein for periods prior to the completion of the Hostess Business Combination is of our accounting Predecessor, Hostess Holdings, and, for periods from and after the Hostess Business Combination, is of Hostess Brands, Inc. The financial information for the year ended December 31, 2016 is divided into Predecessor and Successor periods and is not comparable to the full years ended December 31, 2018 or 2017. Accordingly, such periods are presented on a historical stand-alone basis without comparison.
|
| | | | | | | | | | | | | | | | |
| 2018 | | 2017 | | 2016 |
(In thousands, except share and per share data) | Year Ended December 31 | | Year Ended December 31 | | From November 4 through December 31 | | | From January 1 through November 3 |
| (Successor) | | (Successor) | | (Successor) | | | (Predecessor) |
Net revenue | $ | 850,389 |
| | $ | 776,188 |
| | $ | 111,998 |
| | | $ | 615,588 |
|
Gross profit | 267,277 |
| | 326,898 |
| | 38,714 |
| | | 266,529 |
|
As a % of net revenue | 31.4 | % | | 42.1 | % | | 34.6 | % | | | 43.3 | % |
Operating costs and expenses | $ | 145,719 |
| | $ | 92,906 |
| | $ | 48,321 |
| | | $ | 143,657 |
|
Operating income (loss) | 121,558 |
| | 233,992 |
| | (9,607 | ) | | | 122,872 |
|
As a % of net revenue | 14.3 | % | | 30.1 | % | | (8.6 | )% | | | 20.0 | % |
Other expense | $ | 27,178 |
| | $ | 43,088 |
| | $ | 6,640 |
| | | $ | 62,008 |
|
Income tax expense (benefit) | 12,954 |
| | (67,204 | ) | | (7,762 | ) | | | 439 |
|
Net income (loss) | 81,426 |
| | 258,108 |
| | (8,485 | ) | | | 60,425 |
|
Net income (loss) attributable to Class A shareholders | $ | 62,895 |
| | $ | 223,897 |
| | $ | (4,404 | ) | | | $ | 57,211 |
|
| | | | | | | | |
Earnings (loss) per Class A share: | | | | | | | | |
Basic | $ | 0.63 |
| | $ | 2.26 |
| | $ | (0.05 | ) | | | |
Diluted | $ | 0.61 |
| | $ | 2.13 |
| | $ | (0.05 | ) | | | |
| | | | | | | | |
Adjusted EBITDA(1) | $ | 186,176 |
| | $ | 230,212 |
| | $ | 31,895 |
| | | $ | 183,408 |
|
(1) Adjusted EBITDA is a non-GAAP measure. See Item 6 of this Annual Report on Form 10-K - Selected Financial Data for definition of Adjusted EBITDA and a reconciliation to net income for each period presented.
Results for the Year Ended December 31, 2018 Compared to Results for the Year Ended December 31, 2017
Net Revenue
Net revenue for the year ended December 31, 2018 increased 9.6% or $74.2 million compared to the year ended December 31, 2017. The Cloverhill Business contributed $74.2 million of incremental net revenue. Our organic net revenue was flat for the year due to declines in the mass retail channel offset by net revenue growth in the dollar, small format and grocery channels. These gains were driven by our current and prior year product innovation including Bakery Petites®, our premium snack line introduced in late 2017, and new branded breakfast products introduced in the fourth quarter of 2018. We also experienced gains in core products such as Donettes and Cupcakes and Coffee Cakes.
Gross Profit
Gross profit was 31.4% of net revenue for the year ended December 31, 2018, compared to 42.1% for the year ended December 31, 2017. The decline was primarily attributable to a combination of the shift in mix of revenue to include our recently acquired non-Hostess® branded products and the incremental costs incurred to transform the Cloverhill Business, which collectively resulted in 650 basis points lower profit margin. Significant capital improvements completed in the fourth quarter of 2018 are expected to further increase efficiency and profitability in 2019. Also contributing to the lower gross profit margin during 2018 were higher transportation costs and other inflationary pressures, including increasing customer allowances which in total resulted in a 340 basis point decrease in gross margin. We executed multi-faceted pricing actions in the fourth quarter to partially offset inflation while maintaining growth potential.
Operating Costs and Expenses
Operating costs and expenses for the year ended December 31, 2018 increased by 56.8% from the year ended December 31, 2017. The increase was attributable to the $50.2 million gain on the remeasurement of the Tax Receivable Agreement in 2017 due to Tax Reform and a change in state tax rates, as well as a forfeiture of share-based compensation. Additionally, in 2018 there were increased costs related to temporary displays in support of promotional programs partially offset by lower corporate incentive compensation.
During the fourth quarter of 2018, we recognized impairment charges of $3.3 million to the goodwill and intangible assets within the In-Store Bakery reporting unit. These charges reflect the decision to discontinue the Hostess Bake Shop product line as compared to expectations when the In-Store Bakery reporting unit was remeasured during the Hostess Business Combination. Based on the impairment assessment, the fair value of the In-Store Bakery reporting unit continues to be well in excess of the initial cash purchase price of the Superior on Main business acquired in 2016. Also in 2018, we recognized a $1.4 million impairment related to the planned disposition of certain production equipment before the end of its useful life.
Operating Income
Operating income for the year ended December 31, 2018 was $121.6 million compared to $234.0 million for the year ended December 31, 2017. The decrease in operating income is due to a decrease in gross margin attributed to the transformation of the Cloverhill Business and inflationary pressures in transportation and production input costs. The $50.2 million gain on remeasurement of the Tax Receivable Agreement due to Tax Reform and changes in state tax law in 2017 also significantly impacted operating income.
Other Expense
For the years ended December 31, 2018 and 2017, interest expense related to our Third Term Loan was $41.3 million and $40.0 million, respectively. Also during the year ended December 31, 2018, we recognized a $12.4 million gain related to the buyout of the Tax Receivable Agreement. During the year ended December 31, 2017, we recognized a $2.6 million loss related to the repricing of our First Term Loan.
Income Taxes
Our effective tax rate was 13.7% for the year ended December 31, 2018 compared to (35.2)% for the year ended December 31, 2017 due to the impact of Tax Reform. For the year ended December 31, 2017, the Company recognized a $111.3 million tax benefit as a result of revaluing its deferred tax liabilities due to the reduced U.S. corporate income tax rate of 21%. The effective tax rate of 13.7% for the year ended December 31, 2018 reflects the benefit of the permanent reduction in the U.S. corporate income tax rate, the tax impact of the gain on the buyout of the Tax Receivable Agreement, and the tax benefit related to revaluing its deferred tax liabilities due to a change in the Company’s estimated state tax rate.
Net Income
For the year ended December 31, 2018, net income was $81.4 million compared to $258.1 million for the year ended December 31, 2017. In 2017, the remeasurement of deferred tax items and the Tax Receivable Agreement, collectively, impacted net income by $161.5 million. In 2018, net income was impacted by transformation costs for the Cloverhill Business and inflationary pressures on transportation and other production costs.
Earnings Per Share
Our earnings per class A share was $0.63 (basic) and $0.61 (dilutive) for the year ended December 31, 2018, compared to $2.26 (basic) and $2.13 (dilutive) for the year ended December 31, 2017. The impact of Tax Reform added approximately $1.50 to our dilutive EPS in 2017.
Adjusted EBITDA
Adjusted EBITDA was $186.2 million for the year ended December 31, 2018, compared to $230.2 million for the year ended December 31, 2017. Losses on the operation of the Cloverhill Business, increased costs due to inflationary pressures from transportation and other input costs and a decline in mass channel sales volume each contributed to the decrease in adjusted EBITDA from the prior year.
Results for the 2016 Successor Period and 2016 Predecessor Period
Net Revenue
Net revenues in the 2016 Predecessor Period were $615.6 million and $112.0 million for the 2016 Successor Period. During the 2016 Predecessor Period, we acquired Superior on Main on May 10, 2016 and reported net revenues of $19.9 million from Superior from the date of acquisition through November 3, 2016. During the 2016 Successor Period, the net revenues for Superior on Main were $6.8 million.
Gross Profit
For the 2016 Predecessor Period, gross profit, including the effect of the special employee incentive compensation paid as a result of the Hostess Business Combination, was $266.5 million, or 43.3% of net revenue.
For the 2016 Successor Period, gross profit was $38.7 million, or 34.6% of net revenue. Excluding the impact of the inventory fair value step-up which resulted from the Hostess Business Combination, adjusted gross margin for the Successor period was 42.5% of net revenue. Adjusted gross margin for the Successor Period compared to the gross margin for the 2016 Predecessor Period declined slightly due to overall changes in mix of products sold.
Operating Costs and Expenses
For the 2016 Predecessor Period, operating costs and expenses were $143.7 million. For the 2016 Successor Period, total operating costs and expenses were $48.3 million, or 43.1% of net revenue, and operating loss was $9.6 million or 8.6% of net revenue. Higher field marketing costs as well as paying a special bonus payment of $2.5 million to certain corporate employees as compensation for their efforts in connection with the Hostess Business Combination occurred in the Predecessor Period.
Additionally, amortization of customer relationships in the 2016 Successor Period was significantly higher than in the 2016 Predecessor Period primarily due to the higher fair value measurement at November 4, 2016 as a result of the Hostess Business Combination compared to the overall fair value of the customer relationships in the Predecessor period. There were no significant changes in the nature of the customer relationships, including overall useful lives in the comparative periods.
Also, during the 2016 Predecessor Period, we recorded an impairment of $7.3 million as we closed multiple production lines at our Indianapolis, Indiana bakery and transitioned production to other facilities.There were no such impairments in the 2016 Successor Period.
For the 2016 Predecessor Period, related party expenses were $3.5 million, or 0.6% of net revenue. These amounts represent the annual cash payments associated with our employment arrangements with Mr. Metropoulos as Chief Executive Officer and/or Executive Chairman. For the 2016 Successor Period, the Company expensed $26.8 million, or 23.9% of net revenue, as a result of a grant of stock awarded to Mr. Metropoulos as required under his new employment arrangements.
Operating Income (Loss)
For the 2016 Predecessor Period operating income was $122.9 million, or 20.0% of net revenue. Operating loss for the 2016 Successor Period was significantly impacted by the related party expense discussed above.
Other Expense
For the 2016 Predecessor Period, Other Expense was $62.0 million as compared to $6.6 million in the 2016 Successor Period. The lower interest expense in the 2016 Successor Period is a result of the reduced applicable interest rates following the refinancing of our First Term Loan. Additionally, in connection with the refinancing, we recorded a net gain on a partial extinguishment of debt in the amount of $0.8 million. The gain consisted of the write-off of approximately $4.0 million of debt premium and deferred financing costs, partially offset by prepayment penalties of $3.0 million and the write-off of deferred financing costs of $0.2 million.
Professional and transactional costs for acquisition activity, which has since been abandoned, partially offset by a gain from the settlement in connection with a product recall matter with one of our suppliers of approximately $0.8 million.
Income Tax Expense (Benefit)
For the 2016 Predecessor Period, the Company was a series of limited liability companies and, therefore, had no tax income expense or benefit, except insignificant amounts for Superior, a C corporation.
For the 2016 Successor Period, the income tax benefit was $7.8 million. This represented an effective tax rate of 47.8% which exceeds the statutory rates primarily due to the reversal of a previously recorded valuation allowance.
Segments
The Company has two reportable segments: Sweet Baked Goods and In-Store Bakery. The Company’s Sweet Baked Goods segment consists of fresh and frozen baked goods and bread products that are sold under the Hostess®, Dolly Madison®, Cloverhill® and Big Texas® brands. The In-Store Bakery segment consists of Superior on Main® branded and store-branded products sold through the in-store bakery section of grocery and club stores.
We evaluate performance and allocate resources based on net revenue and gross profit. Information regarding the operations of these reportable segments is as follows:
|
| | | | | | | | | | | | | | | | |
(In thousands) | Year Ended
December 31,
2018 | | Year Ended
December 31,
2017 | | From November 4
through
December 31,
2016 | | | From January 1
through
November 3, 2016 |
| (Successor) | | (Successor) | | (Successor) | | | (Predecessor) |
Net revenue: | | | | | | | | |
Sweet Baked Goods | $ | 808,355 |
| | $ | 733,827 |
| | $ | 105,211 |
| | | $ | 595,645 |
|
In-Store Bakery | 42,034 |
| | 42,361 |
| | 6,787 |
| | | 19,943 |
|
Net revenue | $ | 850,389 |
| | $ | 776,188 |
| | $ | 111,998 |
| | | $ | 615,588 |
|
|
|
| |
|
| | | | | |
Gross profit: | | | | | | | | |
Sweet Baked Goods | $ | 258,995 |
| | $ | 316,916 |
| | $ | 37,387 |
| | | $ | 260,876 |
|
In-Store Bakery | 8,282 |
| | 9,982 |
| | 1,327 |
| | | 5,653 |
|
Gross profit | $ | 267,277 |
| | $ | 326,898 |
| | $ | 38,714 |
| | | $ | 266,529 |
|
|
|
| |
|
| | | | | |
Capital expenditures (1): | | | | | | | | |
Sweet Baked Goods | $ | 53,394 |
| | $ | 35,609 |
| | $ | 7,544 |
| | | $ | 31,254 |
|
In-Store Bakery | 354 |
| | 774 |
| | 83 |
| | | 223 |
|
Capital expenditures | $ | 53,748 |
| | $ | 36,383 |
| | $ | 7,627 |
| | | $ | 31,477 |
|
| |
(1) | For all periods presented, capital expenditures consists of purchases of property and equipment and acquisition and development of software assets paid in cash or acquired through accounts payable. |
Sweet Baked Goods net revenue for the year ended December 31, 2018 increased $74.5 million, or 10.2%, from the year ended December 31, 2017. The operations of the recently acquired Cloverhill Business contributed $74.2 million of net revenue. Excluding the Cloverhill Business, the segment’s net revenue grew from the prior period due to higher sales in our small format, grocery and dollar channels partially offset by lower revenue in our mass retail channel.
Sweet Baked Goods gross profit for the year ended December 31, 2018 was 32.0% of net revenue, compared to 43.2% of net revenue for the year ended December 31, 2017. The decline was primarily attributed to the addition of the Cloverhill Business revenue at negative margins during the transformation of the business as well as higher transportation costs and other inflationary pressures.
In-Store Bakery net revenue for the year ended December 31, 2018 decreased 0.8% from the year ended ended December 31, 2017 due to a shift in product mix resulting from the discontinuance of certain Hostess® branded products previously sold in the In-Store Bakery channel. In-Store Bakery gross profit for the year ended December 31, 2018 was 19.7% of net revenue compared to 23.6% for the year ended December 31, 2017. The decrease in gross profit was attributed to lower sales volume and higher overhead absorption. Gross profit was further affected by higher transportation and other inflationary costs.
Sweet Baked Goods net revenue was $595.6 million for the 2016 Predecessor Period and $105.2 million for the 2016 Successor Period, while In-Store Bakery had net revenue of $19.9 million and $6.8 million for the 2016 Predecessor and 2016 Successor Periods respectively. Sweet Baked Goods gross profit for the 2016 Predecessor Period was $260.9 million compared to $37.4 million for the 2016 Successor Period.
Liquidity and Capital Resources
Our primary sources of liquidity are from the cash and cash equivalents on the balance sheet, future cash flow generated from operations, and availability under our revolving credit agreement (“Revolver”). We believe that cash flows from operations and the current cash and cash equivalents on the balance sheet will be sufficient to satisfy the anticipated cash requirements associated with our existing operations for at least the next 12 months. Our ability to generate sufficient cash from our operating activities depends on our future performance, which is subject to general economic, political, financial, competitive and other factors beyond our control. In addition, our future capital expenditures and other cash requirements could be higher than we currently expect as a result of various factors, including any expansion of our business that we undertake, including acquisitions. We consider all highly liquid investments purchased with an original maturity of three months or less to be cash equivalents.
We had working capital, excluding cash, as of December 31, 2018 and 2017 of $12.0 million and $15.5 million, respectively. We have the ability to borrow under our Revolver to meet obligations as they come due. As of December 31, 2018, we had approximately $96.1 million available for borrowing, net of letters of credit, under our Revolver.
Cash Flows from Operating Activities
Cash flows provided by operating activities for the year ended December 31, 2018 were $143.7 million compared to cash flows for the year ended December 31, 2017 of $163.7 million, $13.6 million for the successor period from November 4, 2016 through December 31, 2016 and $102.2 million for the 2016 Predecessor Period. The decrease in operating cash flows from 2017 to 2018 were driven by a decrease in operating income from 2017, countered by the timing of vendor payments as well as lower tax payments. Cash flows provided by operating activities during 2017 was driven by an increase in income before taxes and benefits from accounts payable and customer trade allowances, offset by higher inventory, accounts receivable, and prepaid expense balances. Cash flows provided by operating activities for both 2016 periods was reduced by the payment of transaction costs related to the Hostess Business Combination.
Cash Flows used in Investing Activities
Cash flows used in investing activities for the years ended December 31, 2018 and 2017 were $70.9 million and $35.2 million, $428.2 million for the 2016 Successor Period and $76.6 million for the 2016 Predecessor Period. During 2018, our investing cash outflow was primarily attributed to the purchase of the Cloverhill Business and subsequent capital investment in the property and equipment in the purchased bakery. In 2017, our investing cash outflow was primarily related to investment in the production lines at our other bakeries. The acquisition of Superior and Hostess during the 2016 Predecessor Period and 2016 Successor Period, respectively, represented a significant investment of cash. Our property and equipment capital expenditures primarily consisted of strategic growth initiatives, maintenance and productivity improvements.
Cash Flows used in Financing Activities
Cash flows used in financing activities were $62.0 million and $19.6 million for the years ended December 31, 2018, and 2017, $232.3 million for the 2016 Successor Period and $31.6 million for the 2016 Predecessor Period. During the year ended December 31, 2018, we bought out a portion of the Tax Receivable Agreement for $34.0 million, we also made the first payment to the remaining Tax Receivable Agreement counterparties as well as the scheduled principal payments on our long-term debt and distributions to the non-controlling interest to cover income tax payments. For the year ended December 31, 2017, financing activities were primarily attributed to scheduled principal payments on long term debt and distributions to the non-controlling interest. For the 2016 Successor Period, we had $13.1 million of deferred underwriting costs related to the Hostess Business Combination.
In the 2016 Successor Period, we extinguished the former second term loan through early principal payments and refinanced our first lien term loan which accounted for the primary use of cash used in financing activities. In the 2016 Predecessor Period, distributions of $23.6 million were paid to partners, and $1.0 million were paid to non-controlling interest.
Long-Term Debt
As of December 31, 2018, $983.8 million aggregate principal amount of the Third Amended First Lien Term Loan and $3.9 million aggregate principal amount of letters of credit, reducing the amount available under the Revolver, were outstanding. See Note 14 - “Commitments and Contingencies” to the consolidated financial statements in Part II, Item 8 of this Annual Report on Form 10-K for information regarding the letters of credit. We had no outstanding borrowings under our Revolver as of December 31, 2018. As of December 31, 2018, we were in compliance with all covenants under the Third Amended First Lien Term Loan and the Revolver. The Revolver contains certain restrictive financial covenants. Based on our current and projected financial performance, we believe that we will comply with these covenants for the foreseeable future.
Commitments and Contingencies
As of December 31, 2018, the Company has commitments and contingencies for tax receivable arrangements, debt, operating leases, and advance purchase commitments. Refer to Note 14 -“Commitments and Contingencies” to the consolidated financial statements included in Part II, Item 8 on this Annual Report on Form 10-K.
|
| | | | | | | | | | | | | | | | | | | |
Contractual Commitments as of December 31, 2018 | Total Committed | | Less than 1 year | | 1 to 3 years | | 3 to 5 years | | More than 5 years |
(In thousands) | | | | | | | | | |
Tax receivable agreement | $ | 69,063 |
| | $ | 4,400 |
| | $ | 8,400 |
| | $ | 8,000 |
| | $ | 48,263 |
|
First term loan | 983,825 |
| | 9,938 |
| | 973,887 |
| | — |
| | — |
|
Interest payments on term loan | 167,693 |
| | 42,571 |
| | 125,122 |
| | — |
| | — |
|
Operating leases | 832 |
| | 832 |
| | — |
| | — |
| | |
Capital lease | 433 |
| | 200 |
| | 233 |
| | — |
| | — |
|
Ingredient procurement | 76,188 |
| | 76,188 |
| | — |
| | — |
| | — |
|
Packaging procurement | 17,168 |
| | 17,168 |
| | — |
| | — |
| | — |
|
| $ | 1,315,202 |
| | $ | 151,297 |
| | $ | 1,107,642 |
| | $ | 8,000 |
| | $ | 48,263 |
|
Tax receivable agreement
The tax receivable agreement entered into in connection with the Hostess Business Combination (the “Tax Receivable Agreement”) generally provides for the payment by the Company to the Legacy Hostess Equityholders of 85% of the net cash savings, if any, in U.S. federal, state and local income tax that the Company actually realizes (or is deemed to realize in certain circumstances) in periods after the closing of the Hostess Business Combination (which periods may extend, unless the Tax Receivable Agreement is terminated early in accordance with its terms, for more than 15 years following any exchange of Class B units of Hostess Holdings for shares of the Company’s Class A common stock or the cash equivalent thereof) as a result of (i) certain increases in tax basis resulting from the Hostess Business Combination; (ii) certain tax attributes of Hostess Holdings and its subsidiaries existing prior to the Hostess Business Combination and prior to subsequent exchanges of Class B units; (iii) certain increases in tax basis resulting from exchanges of Class B units; (iv) imputed interest deemed to be paid by the Company as a result of payments it makes under the Tax Receivable Agreement; and (v) certain increases in tax basis resulting from payments the Company makes under the Tax Receivable Agreement. The Company retained the benefit of the remaining 15% of these cash savings. Certain payments under the Tax Receivable Agreement will be made to the Metropoulos Entities in accordance with specified percentages, regardless of the source of the applicable tax attribute. The most significant estimate utilized by management to calculate the corresponding liability is the Company’s future cash tax savings rates, which are projected based on current tax laws and the Company’s historical and projected future tax profile.
In January 2018, we entered into an agreement with the Apollo Funds terminating all future payment obligations to the Apollo Funds in exchange for a payment of $34.0 million. Subsequent to the agreement, we will now retain a greater portion of the net cash tax savings related to tax attributes subject to the Tax Receivable Agreement.
During the year ended December 31, 2017, we recognized a gain of $51.8 million related to the adjustment to the Tax Receivable Agreement due to the impact of Tax Reform.
Critical Accounting Policies
The preparation of financial statements in accordance with generally accepted accounting principles in the United States requires the use of judgment, estimates and assumptions. We make such subjective determinations after careful consideration of our historical performance, management’s experience, current economic trends and events and information from outside sources. Inherent in this process is the possibility that actual results could differ from these estimates and assumptions for any particular period.
Our significant accounting policies are detailed in Note 1 to our consolidated financial statements within Item 8. The following areas are the most important and require the most difficult, subjective judgments.
Trade and consumer promotion programs
We offer various sales incentive programs to customers and consumers, such as feature price discounts, in-store display incentives, cooperative advertising programs, new product introduction fees, and coupons. The mix between promotional programs, which are classified as reductions in revenue in the Statement of Operations, and advertising or other marketing activities, which are classified as marketing and selling expenses in the Statement of Operations, fluctuates between periods based on our overall marketing plans, and such fluctuations have an impact on revenues. These trade programs also require management to make estimates about the expected total cost of the programs and related allocations amongst participants (who might have different levels of incentives based on various program requirements). These estimates are inherently uncertain and are generally based on historical experience, adjusted for any new facts or circumstances that might impact the ultimate cost estimate for a particular program or programs.
Goodwill and Indefinite-lived trade names
When evaluating goodwill and indefinite-lived intangible assets for impairment under U.S. GAAP, we may first perform an assessment of qualitative factors to determine if the fair value of the reporting unit or the intangible asset is more-likely-than-not greater than the carrying amount. Such qualitative factors include, but are not limited to, macro-economic conditions, market and industry conditions, cost considerations, competitive environment, share price fluctuations, overall financial performance and results of past impairment tests. Based on a review of the qualitative factors, if we determine it is not more-likely-than-not that the fair value is less than the carrying value, we may bypass the quantitative impairment test. We also may elect not to perform the qualitative assessment for some or all reporting units and perform a quantitative impairment test. For our 2018 annual impairment testing, we elected to perform a quantitative assessment for all of our reporting units. This test estimated the fair value of each of the reporting units and compared it to the carrying value. If the fair value was in excess of the carrying value, no impairment existed. Otherwise, an impairment loss would have been recognized for the amount that the carrying value of a reporting unit, including goodwill, exceeded its fair value.
In performing the quantitative test of goodwill, fair value was determined based on a calculation which gave consideration to an income approach utilizing the discounted cash flow method and the market approach using the market comparable method and market transaction method.
Significant assumptions used to determine fair value under the discounted cash flow method included future trends in sales, operating expenses, capital expenditures and changes in working capital. When forecasting these future trends, we utilized historical financial performance, expected terminal growth rates, known industry-specific trends as well internal forecasts and planned initiatives including expected innovation which would impact financial performance. In addition to projected financial information, we also developed an appropriate discount rate for each reporting unit reflecting the reporting unit’s estimated cost of equity capital and after-tax cost of debt, which we estimated by considering the reporting unit’s current borrowing rate, required return on invested capital and future economic and market conditions.
Significant assumptions used to determine the fair value under the market comparable and market transaction methods utilized for the market approach included the identification of publicly-traded companies and transactions involving a purchase or sale. When identifying such companies or transactions, we considered size, industry, product and geographic diversification and cost structure.
Based on the results of this testing, the fair value of Sweet Baked Goods reporting unit exceeded its carrying value by 3.1%. The fair value of the In-Store Bakery reporting unit was less than its carrying value and we recognized an impairment charge to goodwill. Changes in certain significant assumptions could have a significant impact on the estimated fair value, and therefore, a future impairment or additional impairments could result for a portion of goodwill, long-lived assets or intangible assets.
Our indefinite-lived intangible assets consist of trademarks and trade names. The $1,410.5 million and $1,408.8 million balances at December 31, 2018 and 2017, respectively, were recognized as part of the Hostess Business Combination and the acquisition of the Cloverhill Business. The trademarks and trade names are integral to the Company’s identity and are expected to contribute indefinitely to our corporate cash flows. Fair value for trademarks and tradenames was determined using the income approach. The application of the income approach was premised on a royalty savings method, whereby the trademark and tradenames are valued by reference to the amount of royalty income they could generate if they were licensed, in an arm’s‑length transaction, to a third party. These assets have been assigned an indefinite life and therefore are not amortized but rather evaluated for impairment annually using the qualitative or quantitative methods similar to goodwill. During 2018, we performed a quantitative assessment. For this assessment, the valuation of trademarks and trade names are determined using the relief from royalty method. significant assumptions used in this method include future trends in sales, a royalty rate and a discount rate to be applied to the forecast revenue stream.
As a result of these quantitative tests, we recognized impairment charges of $3.3 million to the In-Store Bakery goodwill and intangibles during the year ended December 31, 2018.
Business Combinations
We account for acquisitions using the purchase method of accounting. Assets acquired, liabilities assumed, and non-controlling interests are recorded at their estimated fair values at the acquisition date. The excess of purchase price over fair value of the net assets acquired, including the amount assigned to identifiable intangible assets, is recorded as goodwill. Given the time it takes to obtain pertinent information to finalize the acquired company’s balance sheet, it may be multiple quarters before we are able to finalize those initial fair value estimates. Accordingly, it is not uncommon for the initial estimates to be subsequently revised.
Tax Receivable Agreement
We recognize a liability on the consolidated balance sheet based on the undiscounted estimated future payments under the Tax Receivable Agreement.
New Accounting Pronouncements
Refer to Note 1.Summary of Significant Accounting Policies of the Notes to the consolidated financial statements included in Part II, Item 8 of this Annual Report on Form 10-K for further information regarding recently issued accounting standards.
Item 7A. Quantitative and Qualitative Disclosures about Market Risk
We are exposed to interest rate market risk.
Market risk on variable-rate financial instruments
Our Third Term Loan and Revolver each bear interest on outstanding borrowings thereunder at variable interest rates. The rate in effect at December 31, 2018 for the outstanding Third Term Loan was a LIBOR-based rate of 4.6% per annum. At December 31, 2018, the subsidiary borrower had an aggregate principal balance of $983.8 million outstanding under the Third Term Loan. At December 31, 2018, the subsidiary borrower had $96.1 million available for borrowing, net of letters of credit of $3.9 million, under its Revolver. Increases in market interest rates would cause interest expense to increase and earnings before income taxes to decrease.
To manage the risk related to our variable rate debt, we have entered into an interest rate swap contract with a counter party to make a series of payments based on a fixed interest rate of 1.78% and receive a series of payments based on the greater of LIBOR or 0.75%. Both the fixed and floating payment streams are based on a notional amount of $500 million at the inception of the contract and will be reduced by $100 million each year of the five year contract. At December 31, 2018, a notional amount of $400 million remained outstanding on the swap contract.
The change in interest expense and earnings before income taxes resulting from a change in market interest rates would be dependent upon the weighted average outstanding borrowings and the portion of those borrowings that are hedged by our swap contract during the reporting period following an increase in market interest rates. An increase or decrease in applicable interest rates of 1% would result in an increase or decrease in interest payable of approximately $5.6 million for the year ended December 31, 2018, after accounting for the impact of our swap contract.
Item 8. Financial Statements and Supplementary Data
|
| |
INDEX TO CONSOLIDATED FINANCIAL STATEMENTS |
Audited Consolidated Financial Statements | |
Report of Independent Registered Public Accounting Firm | |
Consolidated Balance Sheets as of December 31, 2018 and December 31, 2017 | |
Consolidated Statements of Operations for the years ended December 31, 2018 and 2017 (Successor), from November 4, 2016 through December 31, 2016 (Successor), and from January 1, 2016 through November 3, 2016 (Predecessor) | |
Consolidated Statements of Comprehensive Income (Loss) for the years ended December 31, 2018 and 2017 (Successor), from November 4, 2016 through December 31, 2016 (Successor), and from January 1, 2016 through November 3, 2016 (Predecessor) | |
Consolidated Statements of Stockholders’ Equity for the years ended December 31, 2018 and 2017 (Successor), from November 4, 2016 through December 31, 2016 (Successor), and Partners’ Equity (Deficit) from January 1, 2016 through November 3, 2016 (Predecessor) | |
Consolidated Statements of Cash Flows for the years ended December 31, 2018 and 2017 (Successor), November 4, 2016 through December 31, 2016 (Successor), and from January 1, 2016 through November 3, 2016 (Predecessor) | |
Notes to Consolidated Financial Statements | |
Report of Independent Registered Public Accounting Firm
To the Shareholders and Board of Directors
Hostess Brands, Inc.:
Opinions on the Consolidated Financial Statements and Internal Control Over Financial Reporting
We have audited the accompanying consolidated balance sheets of Hostess Brands, Inc. and subsidiaries (the Company) as of December 31, 2018 and 2017, the related consolidated statements of operations, comprehensive income (loss), stockholders’ equity, and cash flows for the years ended December 31, 2018 and 2017 and for the period November 4, 2016 through December 31, 2016, and the related notes. We have also audited the accompanying consolidated statements of operations, partners’ equity (deficit), and cash flows for the period January 1, 2016 through November 3, 2016 of Hostess Holdings, L.P. and subsidiaries, and the related notes (collectively with the consolidated financial statements of Hostess Brands, Inc., the “consolidated financial statements”). We also have audited the Company’s internal control over financial reporting as of December 31, 2018, based on criteria established in Internal Control - Integrated Framework (2013) issued by the Committee of Sponsoring Organizations of the Treadway Commission.
In our opinion, the consolidated financial statements referred to above present fairly, in all material respects, the financial position of Hostess Brands, Inc. and subsidiaries as of December 31, 2018 and 2017, and the results of their operations and their cash flows for the years ended December 31, 2018 and 2017 and for the period November 4, 2016 through December 31, 2016, in conformity with U.S. generally accepted accounting principles. It is also our opinion that the financial statements present fairly, in all material respects, the results of Hostess Holdings, L.P. and subsidiaries’ operations and cash flows for the period January 1, 2016 through November 3, 2016, in conformity with U.S. generally accepted accounting principles. Also in our opinion, the Company maintained, in all material respects, effective internal control over financial reporting as of December 31, 2018, based on criteria established in Internal Control - Integrated Framework (2013) issued by the Committee of Sponsoring Organizations of the Treadway Commission.
Basis for Opinions
The Company’s management is responsible for these consolidated financial statements, for maintaining effective internal control over financial reporting, and for its assessment of the effectiveness of internal control over financial reporting, included in the accompanying Management’s Report on Internal Control Over Financial Reporting. Our responsibility is to express an opinion on the Company’s consolidated financial statements and an opinion on the Company’s internal control over financial reporting based on our audits. We are a public accounting firm registered with the Public Company Accounting Oversight Board (United States) (PCAOB) and are required to be independent with respect to the Company in accordance with the U.S. federal securities laws and the applicable rules and regulations of the Securities and Exchange Commission and the PCAOB.
We conducted our audits in accordance with the standards of the PCAOB. Those standards require that we plan and perform the audits to obtain reasonable assurance about whether the consolidated financial statements are free of material misstatement, whether due to error or fraud, and whether effective internal control over financial reporting was maintained in all material respects.
Our audits of the consolidated financial statements included performing procedures to assess the risks of material misstatement of the consolidated financial statements, whether due to error or fraud, and performing procedures that respond to those risks. Such procedures included examining, on a test basis, evidence regarding the amounts and disclosures in the consolidated financial statements. Our audits also included evaluating the accounting principles used and significant estimates made by management, as well as evaluating the overall presentation of the consolidated financial statements. Our audit of internal control over financial reporting included obtaining an understanding of internal control over financial reporting, assessing the risk that a material weakness exists, and testing and evaluating the design and operating effectiveness of internal control based on the assessed risk. Our audits also included performing such other procedures as we considered necessary in the circumstances. We believe that our audits provide a reasonable basis for our opinions.
Definition and Limitations of Internal Control Over Financial Reporting
A company’s internal control over financial reporting is a process designed to provide reasonable assurance regarding the reliability of financial reporting and the preparation of financial statements for external purposes in accordance with generally accepted accounting principles. A company’s internal control over financial reporting includes those policies and procedures that (1) pertain to the maintenance of records that, in reasonable detail, accurately and fairly reflect the transactions and dispositions of the assets of the company; (2) provide reasonable assurance that transactions are recorded as necessary to permit preparation of financial statements in accordance with generally accepted accounting principles, and that receipts and expenditures of the company are being made only in accordance with authorizations of management and directors of the company; and (3) provide reasonable assurance regarding prevention or timely detection of unauthorized acquisition, use, or disposition of the company’s assets that could have a material effect on the financial statements.
Because of its inherent limitations, internal control over financial reporting may not prevent or detect misstatements. Also, projections of any evaluation of effectiveness to future periods are subject to the risk that controls may become inadequate because of changes in conditions, or that the degree of compliance with the policies or procedures may deteriorate.
/s/ KPMG LLP
We have served as the Company’s auditor since 2013.
Kansas City, Missouri
February 27, 2019
HOSTESS BRANDS, INC.
CONSOLIDATED BALANCE SHEETS
(Amounts in thousands, except shares and per share data)
|
| | | | | | | | |
| December 31, | | | December 31, |
ASSETS | 2018 | | | 2017 |
| (Successor) | | | (Successor) |
Current assets: |
| | |
|
Cash and cash equivalents | $ | 146,377 |
| | | $ | 135,701 |
|
Accounts receivable, net | 105,679 |
| | | 101,012 |
|
Inventories | 38,580 |
| | | 34,345 |
|
Prepaids and other current assets | 8,806 |
| | | 7,970 |
|
Total current assets | 299,442 |
| | | 279,028 |
|
Property and equipment, net | 220,349 |
| | | 174,121 |
|
Intangible assets, net | 1,901,215 |
| | | 1,923,088 |
|
Goodwill | 575,645 |
| | | 579,446 |
|
Other assets, net | 14,062 |
| | | 10,592 |
|
Total assets | $ | 3,010,713 |
| | | $ | 2,966,275 |
|
| | | | |
LIABILITIES AND STOCKHOLDERS’ EQUITY | | | | |
| | | | |
Current liabilities: | | | | |
Long-term debt and capital lease obligation payable within one year | $ | 11,268 |
| | | $ | 11,268 |
|
Tax receivable agreement payments payable within one year | 4,400 |
| | | 14,200 |
|
Accounts payable | 65,288 |
| | | 49,992 |
|
Customer trade allowances | 42,010 |
| | | 40,511 |
|
Accrued expenses and other current liabilities | 18,137 |
| | | 11,880 |
|
Total current liabilities | 141,103 |
| | | 127,851 |
|
Long-term debt and capital lease obligation | 976,736 |
| | | 987,920 |
|
Tax receivable agreement | 64,663 |
| | | 110,160 |
|
Deferred tax liability | 277,954 |
| | | 267,771 |
|
Total liabilities | 1,460,456 |
| | | 1,493,702 |
|
Commitments and Contingencies (Note 14) |
| | |
|
Class A common stock, $0.0001 par value, 200,000,000 shares authorized, 100,046,392 and 99,791,245 shares issued and outstanding at December 31, 2018 and 2017, respectively | 10 |
| | | 10 |
|
Class B common stock, $0.0001 par value, 50,000,000 shares authorized, 30,255,184 and 30,319,564 shares issued and outstanding at December 31, 2018 and 2017, respectively | 3 |
| | | 3 |
|
Additional paid in capital | 925,902 |
| | | 920,723 |
|
Accumulated other comprehensive income | 2,523 |
| | | 1,318 |
|
Retained earnings | 271,365 |
| | | 208,279 |
|
Stockholders’ equity | 1,199,803 |
| | | 1,130,333 |
|
Non-controlling interest | 350,454 |
| | | 342,240 |
|
Total liabilities, stockholders’ equity and non-controlling interest | $ | 3,010,713 |
| | | $ | 2,966,275 |
|
See accompanying notes to the consolidated financial statements.
HOSTESS BRANDS, INC.
CONSOLIDATED STATEMENTS OF OPERATIONS
(Amounts in thousands, except shares and per share data)
|
| | | | | | | | | | | | | | | | |
| Year Ended
December 31, 2018 | | Year Ended
December 31, 2017 | | From
November 4, 2016
through
December 31, 2016 | | | From
January 1, 2016
through
November 3, 2016 |
| (Successor) | | (Successor) | | (Successor) | | | (Predecessor) |
Net revenue | $ | 850,389 |
| | $ | 776,188 |
| | $ | 111,998 |
| | | $ | 615,588 |
|
Cost of goods sold | 583,112 |
| | 449,290 |
| | 73,284 |
| | | 349,059 |
|
Gross profit | 267,277 |
| | 326,898 |
| | 38,714 |
| | | 266,529 |
|
| | | | | | | | |
Operating costs and expenses: | | | | | | | | |
Advertising and marketing | 35,069 |
| | 33,004 |
| | 5,245 |
| | | 30,626 |
|
Selling expense | 30,071 |
| | 32,086 |
| | 5,033 |
| | | 25,730 |
|
General and administrative | 52,760 |
| | 52,943 |
| | 7,322 |
| | | 38,391 |
|
Amortization of customer relationships | 24,057 |
| | 23,855 |
| | 3,922 |
| | | 1,185 |
|
Business combination transaction costs | 297 |
| | — |
| | — |
| | | 31,832 |
|
Related party expenses | 362 |
| | 381 |
| | 26,799 |
| | | 3,539 |
|
Tax receivable agreement liability remeasurement | (1,866 | ) | | (50,222 | ) | | — |
| | | — |
|
Other operating expense | 4,969 |
| | 859 |
| | — |
| | | 12,354 |
|
Total operating costs and expenses | 145,719 |
| | 92,906 |
| | 48,321 |
| | | 143,657 |
|
Operating income (loss) | 121,558 |
| | 233,992 |
| | (9,607 | ) | | | 122,872 |
|
Other (income) expense: |
| |
| |
| | |
|
Interest expense, net | 39,404 |
| | 39,174 |
| | 6,649 |
| | | 60,384 |
|
Gain on buyout of tax receivable agreement | (12,372 | ) | | — |
| | — |
| | | — |
|
Other expense (income) | 146 |
| | 3,914 |
| | (9 | ) | | | 1,624 |
|
Total other expense | 27,178 |
| | 43,088 |
| | 6,640 |
| | | 62,008 |
|
Income (loss) before income taxes | 94,380 |
| | 190,904 |
| | (16,247 | ) | | | 60,864 |
|
Income tax expense (benefit) | 12,954 |
| | (67,204 | ) | | (7,762 | ) | | | 439 |
|
Net income (loss) | 81,426 |
| | 258,108 |
| | (8,485 | ) | | | 60,425 |
|
Less: Net income (loss) attributable to the non-controlling interest | 18,531 |
| | 34,211 |
| | (4,081 | ) | | | 3,214 |
|
Net income (loss) attributable to Class A stockholders/partners | $ | 62,895 |
| | $ | 223,897 |
| | $ | (4,404 | ) | | | $ | 57,211 |
|
| | | | | | | | |
Earnings (loss) per Class A share: |
| |
| |
| | |
|
Basic | 0.63 |
| | 2.26 |
| | (0.05 | ) | | |
|
Diluted | 0.61 |
| | 2.13 |
| | (0.05 | ) | | |
|
Weighted-average shares outstanding: |
| |
| |
| | |
|
Basic | 99,957,049 |
| | 99,109,629 |
| | 97,791,658 |
| | |
|
Diluted | 103,098,394 |
| | 105,307,293 |
| | 97,791,658 |
| | |
|
See accompanying notes to the consolidated financial statements.
HOSTESS BRANDS, INC.
CONSOLIDATED STATEMENTS OF COMPREHENSIVE INCOME (LOSS)
(Amounts in thousands)
|
| | | | | | | | | | | | | | | | |
| Year Ended
December 31,
2018 | | Year Ended
December 31,
2017 | | From
November 4, 2016
through
December 31, 2016 | | | From
January 1, 2016
through
November 3, 2016 |
| (Successor) | | (Successor) | | (Successor) | | | (Predecessor) |
Net income (loss) | $ | 81,426 |
| | $ | 258,108 |
| | $ | (8,485 | ) | | | $ | 60,425 |
|
Other comprehensive income: |
| |
| |
| | |
|
Unrealized income on interest rate swap designated as a cash flow hedge | 2,187 |
| | 2,878 |
| | — |
| | | — |
|
Income tax expense | (470 | ) | | (890 | ) | | — |
| | | — |
|
Comprehensive income (loss) | 83,143 |
| | 260,096 |
| | (8,485 | ) | | | 60,425 |
|
Less: Comprehensive income (loss) attributed to non-controlling interest | 19,050 |
| | 34,881 |
| | (4,081 | ) | | | 3,214 |
|
Comprehensive income (loss) attributed to class A shareholders/partners | $ | 64,093 |
| | $ | 225,215 |
| | $ | (4,404 | ) | | | $ | 57,211 |
|
See accompanying notes to the consolidated financial statements.
HOSTESS BRANDS, INC.
CONSOLIDATED STATEMENTS OF EQUITY (DEFICIT)
(Amounts in thousands, except shares data)
|
| | | | | | | | | | | | | | | | | | | | |
Partners’ Equity (Deficit)
Hostess Holdings, LP (Predecessor) |
| | Class A | | Class C | | Total Partners’
Equity (Deficit) | | Non-controlling
Interest |
Balance – December 31, 2015 | | $ | (276,084 | ) | | $ | (346,046 | ) | | $ | (622,130 | ) | | $ | (37,991 | ) |
Distributions to partners | | (9,817 | ) | | (13,765 | ) | | (23,582 | ) | | (1,027 | ) |
Unit based compensation | | 1,945 | | | 1,945 | | | 3,890 |
| | — |
|
Net income | | 28,605 | | | 28,606 | | | 57,211 |
| | 3,214 |
|
Balance – November 3, 2016 | | $ | (255,351 | ) | | $ | (329,260 | ) | | $ | (584,611 | ) | | $ | (35,804 | ) |
|
| | | | | | | | | | | | | | | | | | | | | | | | | | | | | | | | | |
Stockholders’ Equity Hostess Brands, Inc. (Successor) |
| Class A Voting
Common Stock | | Class B Voting
Common Stock | | Additional
Paid-in Capital | | Accumulated Other Comprehensive Income | | Accumulated
Losses / Retained Earnings | | Total
Stockholders’
Equity | | Non-controlling
Interest |
| Shares | | Amount | | Shares | | Amount | | | | | | | | | | |
Balance–November 4, 2016 | 97,589,217 |
| | $ | 10 |
| | 29,870,688 |
| | $ | 3 |
| | $ | 901,157 |
| | $ | — |
| | $ | (11,214 | ) | | $ | 889,956 |
| | $ | 326,601 |
|
Comprehensive income | — |
| | — |
| | — |
| | — |
| | — |
| | — |
| | (4,404 | ) | | (4,404 | ) | | (4,081 | ) |
Share-based compensation | — |
| | — |
| | 2,496,000 |
| | — |
| | 5,718 |
| | — |
| | — |
| | 5,718 |
| | 17,889 |
|
Exchanges | 661,700 |
| | — |
| | (661,700 | ) | | — |
| | 6,217 |
| | — |
| | — |
| | 6,217 |
| | (6,217 | ) |
Tax receivable agreement arising from exchanges, net of income taxes of $420 | — |
| | — |
| | — |
| | — |
| | (268 | ) | | — |
| | — |
| | (268 | ) | | — |
|
Balance–December 31, 2016 | 98,250,917 |
| | 10 |
| | 31,704,988 |
| | 3 |
| | 912,824 |
| | — |
| | (15,618 | ) | | 897,219 |
| | 334,192 |
|
Comprehensive income | — |
| | — |
| | — |
| | — |
| | — |
| | 1,318 |
| | 223,897 |
| | 225,215 |
| | 34,881 |
|
Share-based compensation, net of income taxes of $2,610 | 154,849 |
| | — |
| | — |
| | — |
| | 4,803 |
| | — |
| | — |
| | 4,803 |
| | — |
|
Exchanges | 1,385,424 |
| | — |
| | (1,385,424 | ) | | — |
| | 13,848 |
| | — |
| | — |
| | 13,848 |
| | (13,848 | ) |
Distributions | — |
| | — |
| | — |
| | — |
| | — |
| | — |
| | — |
| | — |
| | (12,985 | ) |
Payment of taxes for employee stock awards | — |
| | — |
| | — |
| | — |
| | (436 | ) | | — |
| | — |
| | (436 | ) | | — |
|
Exercise of public warrants | 55 |
| | — |
| | — |
| | — |
| | 1 |
| | — |
| | — |
| | 1 |
| | — |
|
Tax receivable agreement arising from exchanges, net of income taxes of $1,898 | — |
| | — |
| | — |
| | — |
| | (10,317 | ) | | — |
| | — |
| | (10,317 | ) | | — |
|
Balance–December 31, 2017 | 99,791,245 |
| | 10 |
| | 30,319,564 |
| | 3 |
| | 920,723 |
| | 1,318 |
| | 208,279 |
| | 1,130,333 |
| | 342,240 |
|
Adoption of new accounting standards net of income taxes of $83 | — |
| | — |
| | — |
| | — |
| | — |
| | 7 |
| | 191 |
| | 198 |
| | 85 |
|
Comprehensive income | — |
| | — |
| | — |
| | — |
| | — |
| | 1,198 |
| | 62,895 |
| | 64,093 |
| | 19,050 |
|
Share-based compensation, net of income taxes of $505 | 190,767 |
| | — |
| | — |
| | — |
| | 5,095 |
| | — |
| | — |
| | 5,095 |
| | — |
|
Exchanges | 64,380 |
| | — |
| | (64,380 | ) | | — |
| | 1,370 |
| | — |
| | | | 1,370 |
| | (1,370 | ) |
Distributions | — |
| | — |
| | — |
| | — |
| | — |
| | — |
| | — |
| | — |
| | (9,551 | ) |
Payment of taxes for employee stock awards | — |
| | — |
| | — |
| | — |
| | (1,025 | ) | | — |
| | — |
| | (1,025 | ) | | — |
|
Tax receivable agreement arising from exchanges, net of income taxes of $33 | — |
| | — |
| | — |
| | — |
| | (261 | ) | | — |
| | — |
| | (261 | ) | | — |
|
Balance–December 31, 2018 | 100,046,392 |
| | $ | 10 |
| | 30,255,184 |
| | $ | 3 |
| | $ | 925,902 |
| | $ | 2,523 |
| | $ | 271,365 |
| | $ | 1,199,803 |
| | $ | 350,454 |
|
See accompanying notes to the consolidated financial statements.
HOSTESS BRANDS, INC.
CONSOLIDATED STATEMENTS OF CASH FLOWS
(Amounts in thousands)
|
| | | | | | | | | | | | | | | | |
| Year Ended
December 31, 2018 |
| Year Ended
December 31, 2017 |
| November 4, 2016
through
December 31, 2016 |
| | January 1, 2016
through
November 3, 2016 |
| (Successor) |
| (Successor) |
| (Successor) |
| | (Predecessor) |
Operating activities | | | | | | | | |
Net income (loss) | $ | 81,426 |
|
| $ | 258,108 |
|
| $ | (8,485 | ) |
| | $ | 60,425 |
|
Depreciation and amortization | 41,411 |
|
| 38,170 |
|
| 5,843 |
|
| | 10,265 |
|
Impairment of property, goodwill and intangibles | 4,717 |
|
| 1,003 |
|
| — |
|
| | 7,300 |
|
Non-cash loss (gain) on debt modification | — |
|
| 1,453 |
|
| (3,974 | ) |
| | — |
|
Debt discount (premium) amortization | (1,079 | ) |
| (925 | ) |
| (197 | ) |
| | 2,790 |
|
Tax receivable agreement remeasurement and gain on buyout | (14,237 | ) |
| (50,222 | ) |
| — |
|
| | — |
|
Stock-based compensation | 5,600 |
|
| 7,413 |
|
| 26,748 |
|
| | 3,890 |
|
Loss on sale/abandonment of property and equipment | 253 |
|
| 11 |
|
| — |
|
| | 2,551 |
|
Deferred taxes | 10,255 |
|
| (81,270 | ) |
| (7,815 | ) |
| | — |
|
Change in operating assets and liabilities | | | | | | | | |
Accounts receivable | (3,667 | ) |
| (11,775 | ) |
| 3,705 |
|
| | (19,869 | ) |
Inventories | 3,569 |
|
| (3,901 | ) |
| 8,895 |
|
| | (2,994 | ) |
Prepaids and other current assets | (510 | ) |
| (3,039 | ) |
| (1,694 | ) |
| | (1,049 | ) |
Accounts payable and accrued expenses | 14,418 |
|
| 4,839 |
|
| (11,296 | ) |
| | 33,886 |
|
Customer trade allowances | 1,499 |
|
| 3,820 |
|
| 2,225 |
|
| | 4,828 |
|
Other | — |
|
| — |
|
| (344 | ) |
| | 198 |
|
Net cash provided by operating activities | 143,655 |
|
| 163,685 |
|
| 13,611 |
|
| | 102,221 |
|
Investing activities |
|
|
|
|
|
|
|
|
| |
|
|
Purchases of property and equipment | (44,585 | ) |
| (32,913 | ) |
| (6,494 | ) |
| | (28,633 | ) |
Acquisition of business, net of cash | (23,160 | ) |
| — |
|
| (421,242 | ) |
| | (49,735 | ) |
Proceeds from sale of assets | 639 |
|
| 85 |
|
| — |
|
| | 4,000 |
|
Acquisition and development of software assets | (3,839 | ) |
| (2,381 | ) |
| (460 | ) |
| | (2,211 | ) |
Net cash used in investing activities | (70,945 | ) |
| (35,209 | ) |
| (428,196 | ) |
| | (76,579 | ) |
|
|
|
|
|
|
|
|
|
| |
|
|
Financing activities |
|
|
|
|
|
|
|
|
| |
|
|
Repayments of long-term debt and capital lease obligation | (10,105 | ) |
| (5,144 | ) |
| (217,400 | ) |
| | (6,987 | ) |
Payment of deferred underwriting costs | — |
|
| — |
|
| (13,125 | ) |
| | — |
|
Debt fees | — |
|
| (1,066 | ) |
| (1,820 | ) |
| | — |
|
Distributions to partners | — |
|
| — |
|
| — |
|
| | (23,582 | ) |
Distributions to non-controlling interest | (9,551 | ) |
| (12,985 | ) |
| — |
|
| | (1,027 | ) |
Payment of taxes related to the net issuance of employee stock awards | (1,025 | ) | | (436 | ) | | — |
| | | — |
|
Payments on tax receivable agreement | (41,353 | ) | | — |
| | — |
| | | — |
|
Proceeds from the exercise of warrants | — |
|
| 1 |
|
| — |
|
| | — |
|
Net cash used in financing activities | (62,034 | ) |
| (19,630 | ) |
| (232,345 | ) |
| | (31,596 | ) |
Net increase (decrease) in cash and cash equivalents | 10,676 |
|
| 108,846 |
|
| (646,930 | ) |
| | (5,954 | ) |
Cash and cash equivalents at beginning of period | 135,701 |
|
| 26,855 |
|
| 673,785 |
|
| | 64,473 |
|
Cash and cash equivalents at end of period | $ | 146,377 |
|
| $ | 135,701 |
|
| $ | 26,855 |
|
| | $ | 58,519 |
|
|
|
|
|
|
|
|
|
|
| |
|
|
Supplemental Disclosures of Cash Flow Information |
|
|
|
|
|
|
|
|
| |
|
|
Interest paid | $ | 37,617 |
|
| $ | 45,431 |
|
| $ | — |
|
| | $ | 68,606 |
|
Taxes paid | $ | 3,422 |
|
| $ | 16,617 |
|
| $ | 43 |
|
| | $ | — |
|
Supplemental disclosure of non-cash investing |
|
|
|
|
|
|
|
|
| |
|
|
Accrued capital expenditures | $ | 7,858 |
|
| $ | 1,089 |
|
| $ | 673 |
|
| | $ | 633 |
|
See accompanying notes to the consolidated financial statements.
HOSTESS BRANDS, INC.
NOTES TO CONSOLIDATED FINANCIAL STATEMENTS
1. Summary of Significant Accounting Policies
Description of Business
Hostess Brands, Inc. is a Delaware corporation headquartered in Kansas City, Missouri. The consolidated financial statements include the accounts of Hostess Brands, Inc. and its wholly owned subsidiaries (collectively, the “Company”). The Company is a leading packaged food company primarily focused on developing, manufacturing, marketing, selling and distributing fresh sweet baked goods in the United States. The Hostess® brand dates to 1919 when the Hostess® CupCake was introduced to the public, followed by Twinkies® in 1930. In 2013, the Legacy Hostess Equityholders (as defined below) acquired the Hostess brand and other assets out of the bankruptcy liquidation proceedings of its prior owners, free and clear of all past liabilities. After a brief hiatus in production, the Company began providing Hostess products to consumers and retailers across the nation in July 2013. Today, the Company produces a variety of new and classic treats primarily under the Hostess®, Dolly Madison®, Cloverhill®, Big Texas®, and Superior on Main® brands, including Twinkies®, CupCakes, Ding Dongs®, HoHos®, Donettes® and Fruit Pies.
On November 4, 2016 (the “Closing Date”), in a transaction referred to as the “Hostess Business Combination,” the Company, then known as Gores Holdings, Inc. (“Gores Holdings”), acquired a controlling interest in Hostess Holdings, L.P. (“Hostess Holdings”), an entity owned indirectly by entities controlled by C. Dean Metropoulos (the “Metropoulos Entities”) and certain equity funds managed by affiliates of Apollo Global Management, LLC (the “Apollo Funds”, and together with the Metropoulos entities, the “Legacy Hostess Equityholders”). “2016 Predecessor Period” refers to the period from January 1, 2016 to November 3, 2016, while the “2016 Successor Period” refers to the period from November 4, 2016 to December 31, 2016. Our “Sponsor” refers to Gores Sponsor, LLC, a Delaware limited liability company and the principal stockholder of Gores Holdings, Inc. prior to the Hostess Business Combination, and the “The Gores Group” refers to The Gores Group LLC, an affiliate of our Sponsor. In connection with the closing of the Hostess Business Combination, Gores Holdings, Inc. changed its name to “Hostess Brands, Inc.” and its trading symbols on NASDAQ from “GRSH” and “GRSHW,” to “TWNK” and “TWNKW”.
As a result of the Hostess Business Combination, for accounting purposes, Hostess Brands, Inc. is the acquirer and Hostess Holdings is the acquired party and accounting predecessor. The Company’s financial statement presentation includes the financial statements of Hostess Holdings and its subsidiaries as “Predecessor” for periods prior to the completion of the Hostess Business Combination and of Hostess Brands, Inc., including the consolidation of Hostess Holdings and its subsidiaries, for periods from and after the Closing Date (referred to as the “Successor”). Unless the context requires otherwise, the “Company” refers to the Predecessor for periods prior to the Hostess Business Combination and to the Successor for periods after the Hostess Business Combination.
Basis of Presentation
The consolidated financial statements included herein have been prepared in accordance with generally accepted accounting principles in the United States of America (“U.S. GAAP”) and the rules and regulations of the Securities and Exchange Commission (“SEC”). The accompanying consolidated financial statements include the accounts of the Company and its majority-owned or controlled subsidiaries, collectively referred to as either Hostess or the Company. All intercompany balances and transactions have been eliminated in consolidation.
The Company has determined that Hostess Holdings, a limited partnership, is a variable interest entity (“VIE”) and that the Company is the primary beneficiary of the VIE. The Company determined that, due to its ownership of Hostess Holdings’ general partnership units, the Company has the power to direct all of the activities of Hostess Holdings, with no substantive kick-out rights or participating rights by the limited partners individually or as a group. Hostess Holdings constitutes the majority of the assets of the Company.
Mr. Metropoulos and the Metropoulos Entities hold their equity investment in the Company primarily through Class B limited partnership units in the Company’s subsidiary, Hostess Holdings (“Class B Units”) and an equal number of shares of the Company’s Class B common stock (“Class B Stock”). The Company’s Class B Stock has voting, but no
HOSTESS BRANDS, INC.
NOTES TO CONSOLIDATED FINANCIAL STATEMENTS
economic, rights, while Hostess Holdings’ Class B Units have economic, but no voting rights. Each Class B Unit, together with a share of Class B Stock held by the Metropoulos Entities, is exchangeable for a share of the Company’s Class A common stock (or at the option of the Company, the cash equivalent thereof). The interest of the Metropoulos Entities in Hostess Holdings’ Class B Units is reflected in our consolidated financial statements as a non-controlling interest. The non-controlling interest was recorded at fair value at November 4, 2016 as a result of the Hostess Business Combination.
For the Predecessor Periods, Hostess Holdings consolidated the financial position and results of operations of New Hostess Holdco, LLC. The portion of the New Hostess Holdco, LLC not owned by Hostess Holdings was recognized as a non-controlling interest in the consolidated financial statements. The non-controlling interest presented in the accompanying consolidated balance sheet represents the amount of cash that would be payable to the non-controlling interest holders if the Company were liquidated at book value as of the balance sheet date. The difference between the calculated liquidation distribution amounts at the beginning and the end of the reporting period, is the share of the earnings or losses allocated to non-controlling interest for the period.
The Company has two reportable segments: Sweet Baked Goods and In-Store Bakery.
Adoption of New Accounting Standards
On January 1, 2018, the Company adopted Accounting Standards Update (“ASU”) No. 2014-09, Revenue from Contracts with Customers (Topic 606), using the modified retrospective transition method. Under this method, results for reporting periods beginning January 1, 2018 are presented under Topic 606. Prior period amounts are not adjusted and continue to be reported in accordance with the historic accounting under Topic 605, with the cumulative effect of applying Topic 606 to prior period amounts recognized as an adjustment to opening retained earnings. The Company has elected to apply the new standard to contracts that were not complete as of January 1, 2018. Under this transition method, the Company deemed contracts to be not complete if, as of the date of transition, the Company had not fulfilled its performance obligations. The impact of the adoption of Topic 606 is further described in the Revenue Recognition section of this footnote.
On January 1, 2018, the Company adopted ASU No. 2017-12, Derivatives and Hedging: Targeted Improvements to
Accounting for Hedging Activities (ASU 2017-12). The adoption of this standard did not have a material impact on the consolidated financial statements.
In March 2018, the Company adopted ASU 2018-05, Income Taxes (Topic 740): Amendments to SEC Paragraphs
Pursuant to SEC Staff Accounting Bulletin No. 118, which updates the income tax accounting in U.S. GAAP to reflect the SEC’s interpretive guidance released on December 22, 2017, when the legislation commonly referred to as the Tax Cuts and Jobs Act (“Tax Reform”) was signed into law. Additional information regarding the adoption of this standard is contained in Note 13-Income Taxes.
In September 2018, the Company adopted ASU 2018-15, Intangibles-Goodwill and Other Internal-Use Software
(Subtopic 350-40): Customer’s Accounting for Implementation Costs Incurred in a Cloud Computing Arrangement
That Is a Service Contract, which aligns the requirements for capitalizing implementation costs incurred in a hosting
arrangement that is a service contract with the requirements for capitalizing implementation costs incurred to develop or obtain internal-use software. The adoption of this standard did not have a material impact on the consolidated financial statements.
Principles of Consolidation
The accompanying consolidated financial statements include the accounts of the Company and its majority-owned or controlled subsidiaries (including those for which the Company is the primary beneficiary of a variable interest entity), collectively referred to as the Company. All intercompany balances and transactions have been eliminated in consolidation.
HOSTESS BRANDS, INC.
NOTES TO CONSOLIDATED FINANCIAL STATEMENTS
Use of Estimates
The preparation of consolidated financial statements in conformity with U.S. GAAP requires management to make estimates and judgments that affect the reported amounts of assets and liabilities at the date of the financial statements and for the reported amounts of revenues and expenses during the reporting period. Management utilizes estimates, including, but not limited to, valuation and useful lives of tangible and intangible assets, valuation of expected future payments under the tax receivable agreement, and reserves for trade and promotional allowances. Actual results could differ from these estimates.
Cash and Cash Equivalents
The Company considers all highly liquid investments purchased with original maturities of three months or less when purchased as cash equivalents and are recorded at cost. Under the Company’s cash management system, checks that have been issued and are out of the control of the Company, but which have not cleared the bank by the balance sheet date, are reported as a reduction of cash.
Accounts Receivable
Accounts receivable represents amounts invoiced to customers for which the Company’s obligation to the customer has been satisfied. As of December 31, 2018 and 2017, the Company’s accounts receivable were $105.7 million and $101.0 million, respectively, which have been reduced by allowances for damages occurring during shipment, quality claims and doubtful accounts in the amount of $2.6 million and $2.1 million, respectively.
Inventories
Inventories are stated at the lower of cost or market on a first-in first-out basis. Abnormal amounts of idle facility expense, freight, handling costs, and wasted material (spoilage) are expensed in the period they are incurred.
The components of inventories are as follows:
|
| | | | | | | |
(In thousands) | December 31,
2018 | | December 31, 2017 |
| (Successor) | | (Successor) |
Ingredients and packaging | $ | 18,865 |
| | $ | 14,826 |
|
Finished goods | 16,446 |
| | 15,471 |
|
Inventory in transit to customers | 3,269 |
| | 4,048 |
|
| $ | 38,580 |
| | $ | 34,345 |
|
Property and Equipment
Property and equipment acquired in Business Combinations were assigned useful lives for purposes of depreciation that the Company believes to be the remaining useful life of such assets. Additions to property and equipment are recorded at cost and depreciated straight line over estimated useful lives of 15 to 50 years for buildings and land improvements and 3 to 20 years for machinery and equipment. In order to maximize the efficiency of the Company’s operations and to operate the acquired equipment, occasionally the Company will remove and relocate equipment between bakeries. Such removal and relocation costs are expensed as incurred. Reinstallation costs are capitalized if the useful life is extended or the equipment is significantly improved. Otherwise, reinstallation costs are expensed as incurred. Expenditures for repairs and maintenance are charged to expense when incurred. Expenditures for major renewals and betterments, which extend the useful lives of existing property and equipment, are capitalized and depreciated. Upon retirement or disposition of property and equipment, the capitalized cost and related accumulated depreciation are removed from the balance sheet and any resulting gain or loss is recognized in the consolidated statements of operations.
HOSTESS BRANDS, INC.
NOTES TO CONSOLIDATED FINANCIAL STATEMENTS
For the year ended December 31, 2018, the Company recorded an impairment loss of $1.4 million in the Sweet Baked Goods segment related to the planned disposition of certain production equipment before the end of its useful life. For the year ended December 31, 2017, the Company recorded an impairment loss of $1.0 million in the Sweet Baked Goods segment related to a production line that was idled when the related production was transitioned to a third party. During the 2016 Predecessor period, the Company recorded an impairment loss of $7.3 million in the Sweet Baked Goods segment when it closed multiple production lines at the Indianapolis, Indiana bakery and transitioned production to other facilities. The measurement of this loss was based on Level 3 inputs within the fair value measurement hierarchy.
Software Costs
Costs associated with computer software projects during the preliminary project stage are expensed as incurred. Once management authorizes and commits to funding a project, appropriate application development stage costs are capitalized. Capitalization ceases when the project is substantially complete and the software is ready for its intended use. Upgrades and enhancements to capitalized software are capitalized when such enhancements are determined to provide additional functionality. Training and maintenance costs associated with software applications are expensed as incurred.
Included in the caption “Other assets” in the consolidated balance sheets is capitalized software in the amount of approximately $8.5 million and $7.3 million at December 31, 2018 and 2017, respectively. Capitalized software costs are amortized over their estimated useful life of five years commencing when such assets are ready for their intended use. Software amortization expense included in general and administrative expense in the consolidated statement of operations was $2.7 million and $2.5 million for the years ended December 31, 2018 and 2017, respectively, $1.5 million for the 2016 Predecessor Period, and $0.3 million for the 2016 Successor Period.
Goodwill and Intangible Assets
At December 31, 2018 and 2017, the goodwill balances of $575.6 million and $579.4 million, respectively, represent the excess of the amount the Successor paid for the Hostess Business Combination over the fair value of the assets acquired and liabilities assumed. Goodwill that resulted from the Hostess Business Combination was allocated to the Sweet Baked Goods reporting unit and the In-Store Bakery reporting unit. No goodwill was recorded in connection with the acquisition of the Cloverhill Business as the fair value of net assets approximated the consideration paid.
Goodwill by reporting unit is tested for impairment annually by either performing a qualitative evaluation or a quantitative test. The qualitative evaluation is an assessment of factors to determine whether it is more likely than not that the fair value of a reporting unit is less than its carrying amount, including goodwill. The Company may elect not to perform the qualitative assessment for some or all reporting units and perform a quantitative impairment test. The Company elected to perform the quantitative test during the year ended December 31, 2018. Fair value was determined based on a combination of an income approach utilizing the discounted cash flow method and the market approach using the market comparable method. Significant assumptions used to determine fair value under the discounted cash flow method included future trends in sales, operating expenses, capital expenditures and changes in working capital, along with an appropriate discount rate based on our estimated cost of equity capital, after-tax cost of debt and future economic and market conditions. If the carrying value of the reporting unit exceeds fair value, goodwill is considered impaired and an impairment charge will be recorded to reduce the reporting unit to fair value.
The Company’s indefinite-lived intangible assets consist of trademarks and trade names. The $1,409.9 million and $1,408.8 million balances at December 31, 2018 and 2017, respectively, were recognized as part of the acquisitions described in Note - 2. Business Combinations. The trademarks and trade names are integral to the Company’s identity and are expected to contribute indefinitely to its corporate cash flows. Fair value for trademarks and tradenames was determined using the income approach, which is considered to be Level 3 within the fair value hierarchy. The application of the income approach was premised on a royalty savings method, whereby the trademark and tradenames are valued by reference to the amount of royalty income they could generate if they were licensed, in an arm’s‑length transaction, to a third party. These assets have been assigned an indefinite life and therefore are not amortized but rather evaluated for impairment annually using the qualitative or quantitative methods similar to goodwill. For the quantitative assessment, the valuation of trademarks and trade names are determined using the relief of royalty method. significant
HOSTESS BRANDS, INC.
NOTES TO CONSOLIDATED FINANCIAL STATEMENTS
assumptions used in this method include future trends in sales, a royalty rate and a discount rate to be applied to the forecast revenue stream.
During the year ended December 31, 2018, the Company recognized impairment charges of $3.3 million to the In-Store Bakery goodwill and intangibles. See Note 6 - Goodwill and Intangible Assets for more information on impairment charges.
Also, the Company has finite-lived intangible assets that consist of customer relationships. The $491.3 million and $514.2 million balances on December 31, 2018 and 2017 respectively, were recognized as part of the Hostess Business Combination and Cloverhill Acquisition. For customer relationships, the application of the income approach (Level 3) was premised on an excess earnings method, whereby the customer relationships are valued by the earnings expected to be generated from those customers after other capital charges. Definite-lived intangible assets are being amortized on a straight‑line basis over the estimated remaining useful lives of the assets.
Reserves for Self-Insurance Benefits
The Company’s employee health plan is self-insured by the Company up to a stop-loss amount of $0.3 million for each participant per plan year. In addition, the Company maintains insurance programs covering its exposure to workers’ compensation. Such programs include the retention of certain levels of risks and costs through high deductibles and other risk retention strategies. Included in the accrued expenses in the consolidated balance sheets is a reserve for healthcare claims in the amount of approximately $1.6 million and $1.1 million at December 31, 2018 and 2017, respectively, and a reserve for workers’ compensation claims of $1.9 million and $1.7 million at December 31, 2018 and 2017, respectively.
Revenue Recognition
Net revenue consists primarily of sales of packaged food products. The Company recognizes revenue when the
obligations under the terms of its agreements with customers have been satisfied. The Company’s obligation is satisfied when control of the product is transferred to its customers along with the title, risk of loss and rewards of ownership. Depending on the arrangement with the customer, these criteria are met either at the time the product is shipped or when the product is received by such customer.
Customers are invoiced at the time of shipment or customer pickup based on credit terms established in accordance with industry practice. Invoices generally require payment within 30 days. Net revenue is recognized in an amount that reflects the consideration the Company expects to be entitled to in exchange for that product. Amounts billed to customers related to shipping and handling are classified as net revenue. A provision for payment discounts and other allowances is estimated based on the Company’s historical performance or specific terms with the customer. The Company generally does not accept product returns and provides these allowances for anticipated expired or damaged products.
Trade promotions, consisting primarily of customer pricing allowances, merchandising funds and consumer coupons, are offered through various programs to customers and consumers. A provision for estimated trade promotions is recorded as a reduction of revenue in the same period when the sale is recognized.
The Company also offers rebates based on purchase levels, product placement locations in retail stores and advertising placed by customers. The ultimate cost of these programs is dependent on certain factors such as actual purchase volumes or customer activities and is the subject of significant management estimates. The Company accounts for these programs as variable consideration and recognizes a reduction in revenue in the same period as the underlying program.
For product produced by third parties, management evaluates whether the Company is the principal (i.e., report revenue on a gross basis) or agent (i.e., report revenue on a net basis). Management has determined that it is the principal in all cases, since it establishes its own pricing for such product, generally assumes the credit risk for amounts billed to its customers, and often takes physical control of the product before it is shipped to customers.
HOSTESS BRANDS, INC.
NOTES TO CONSOLIDATED FINANCIAL STATEMENTS
The Company utilizes a practical expedient approach under Topic 606 and does not disclose the value of unsatisfied performance obligations for (i) contracts with an original expected length of one year or less and (ii) contracts for which the Company recognizes revenue at the amount to which the Company has the right to invoice for services performed.
See Note 5 - Segment Reporting for a disaggregation of net revenue.
The adoption of Topic 606 did not have a significant impact on the Company’s consolidated statement of operations for the year ended December 31, 2018 or the consolidated balance sheet as of December 31, 2018.
The cumulative effect of the changes made to the Company’s consolidated balance sheet as of January 1, 2018 for the adoption of Topic 606 was as follows (in thousands):
|
| | | | | | | | | | | | |
| | Balance at December 31, 2017 | | Adjustments Due to Topic 606 | | Balance at January 1, 2018 |
Current assets: | | | | | | |
Accounts receivable, net | | $ | 101,012 |
| | $ | 1,000 |
| | $ | 102,012 |
|
Inventories | | 34,345 |
| | (531 | ) | | 33,814 |
|
| | | | | | |
Current liabilities: | | | | | | |
Accounts payable | | 49,992 |
| | 103 |
| | 50,095 |
|
| | | | | | |
Long-term liabilities: | | | | | | |
Deferred tax liability | | 267,771 |
| | 83 |
| | 267,854 |
|
| | | | | | |
Stockholders' equity: | | | | | | |
Retained earnings | | 208,279 |
| | 191 |
| | 208,470 |
|
Non-controlling interest | | 342,240 |
| | 85 |
| | 342,325 |
|
The adjustments shown above are primarily attributed to a change in the criteria used to determine when the Company’s performance obligation is satisfied. Prior to the adoption of Topic 606, the Company’s performance obligation was satisfied when risk of loss related to the product transferred to the customer. After implementing Topic 606, the Company’s performance obligation is satisfied based on a set of criteria including the customer’s obligation to pay, physical possession, transfer of legal title, transfer of risk and rewards of ownership and the customer’s acceptance of the product. Depending on the arrangement with the customer, the application of this new criteria changed the timing of revenue recognition for certain contracts.
The Company has one customer that accounted for 10% or more of the Company’s total net revenue. The percentage of total net revenues for this customer is presented below by segment:
|
| | | | | | | | | | | | |
| Year Ended December 31,
2018 | | Year Ended December 31,
2017 | | From
November 4, 2016
through
December 31, 2016 | | | From January 1, 2016
through
November 3, 2016 |
| (Successor) | | (Successor) | | (Successor) | | | (Predecessor) |
Sweet Baked Goods | 20.4 | % | | 19.7 | % | | 19.3 | % | | | 21.2 | % |
In-Store Bakery | 0.6 | % | | 0.7 | % | | 0.7 | % | | | 0.4 | % |
Total | 21.0 | % | | 20.4 | % | | 20.0 | % | | | 21.6 | % |
HOSTESS BRANDS, INC.
NOTES TO CONSOLIDATED FINANCIAL STATEMENTS
Equity Compensation
The grant date fair values of stock options are valued using the Black-Scholes option-pricing model, including a simplified method to estimate the number of periods to exercise date (i.e., the expected option term). Management has determined that the equity plan has not been in place for a sufficient amount of time to estimate the post vesting exercise behavior. Therefore, it will continue to use this simplified method until such time as it has sufficient history to provide a reasonable basis to estimate the expected term. Forfeitures are recognized as a reduction of expense as incurred.
For awards which have performance and market conditions, compensation expense is calculated based on the number of shares expected to vest after assessing the probability that the performance or market criteria will be met. The equity-based compensation expense, net of forfeitures, is recognized using a straight-line basis over the requisite service period of the awards, which corresponds to the vesting periods of the awards. For performance-based awards, compensation expense is remeasured throughout the vesting period as probability is reassessed. For market-based awards, probability is not reassessed and compensation expense is not remeasured subsequent to the initial assessment on the grant date.
Collective Bargaining Agreements
As of December 31, 2018, approximately 40.0%, of the Company’s employees are covered by these collective bargaining agreements. None of these agreements expire before December 31, 2019.
Employee Benefit Plans
The Company provides several benefit plans for employees depending upon employee eligibility. The Company has a health care plan, a defined contribution retirement plan (401(k)), company-sponsored life insurance, and other benefit plans. The Company’s contributions to the defined contribution retirement plan were $1.9 million for the year ended December 31, 2018, $1.1 million for the year ended December 31, 2017, no contributions for the 2016 Successor Period, and $1.1 million for the 2016 Predecessor Period.
The Company offers an annual incentive plan based upon annual operating targets. Final payout is approved by the board of directors. No amounts were accrued for this plan at December 31, 2018. At December 31, 2017, $4.3 million was accrued.
The Company has a long-term incentive plan for certain director-level employees, payment under which is contingent on changes in certain ownership levels. $2.5 million was paid under this plan in the 2016 Predecessor Period and recognized in other operating expenses on the consolidated statement of operations. The total that could be payable to any future qualifying changes in ownership levels under the plan is $1.2 million as of December 31, 2018. The Company does not carry an accrual for the long-term incentive plan.
Income Taxes
As a result of the Hostess Business Combination, Hostess Brands, Inc. acquired a controlling interest in Hostess Holdings, which is treated as a partnership for U.S. federal and most applicable state and local income tax purposes. As a partnership, Hostess Holdings is not directly subject to U.S. federal and certain state and local income taxes. Any taxable income or loss generated by Hostess Holdings is passed through to and included in the taxable income or loss of its partners, including the Company following the Hostess Business Combination. The Company is subject to U.S. federal income taxes, in addition to state and local income taxes with respect to its allocable share of any taxable income of Hostess Holdings following the Hostess Business Combination.
During the year ended December 31, 2017, the Tax Reform was signed into law. The SEC staff issued Staff Accounting Bulletin No. 118 (“SAB 118”) to address the application of U.S. GAAP in situations when a registrant does not have the necessary information available to complete the accounting for Tax Reform. The Company has recognized the tax impacts related to the revaluation of deferred tax assets and liabilities. Further information on the tax impacts of Tax Reform is included in Note 13 - Income Taxes
HOSTESS BRANDS, INC.
NOTES TO CONSOLIDATED FINANCIAL STATEMENTS
Derivatives
The Company has entered into an interest rate swap contract to mitigate its exposure to changes in the variable interest rate on its long-term debt. This contract was designated as a cash flow hedge. Changes in the fair value of this instrument are recognized in accumulated other comprehensive income in the consolidated balance sheets and reclassified into earnings in the period in which the hedged transaction affects earnings. Hedging ineffectiveness, if any, is recognized as a component of interest expense in the consolidated statements of operations. Payments made under this contract are included in the supplemental disclosure of interest in the consolidated statement of cash flows.
Fair Value Measurements
The Company utilizes valuation techniques that maximize the use of observable inputs and minimize the use of unobservable inputs to the best extent possible. The Company determines fair value based on assumptions that market participants would use in pricing an asset or liability in the principal or most advantageous market. When considering market participant assumptions in fair value measurements, the following fair value hierarchy distinguishes between observable and unobservable inputs, which are categorized in one of the following levels:
| |
• | Level 1 inputs: Unadjusted quoted prices in active markets for identical assets or liabilities accessible to the reporting entity at the measurement date. |
| |
• | Level 2 inputs: Other than quoted prices included in Level 1 inputs that are observable for the asset or liability, either directly or indirectly, for substantially the full term of the asset or liability. |
| |
• | Level 3 inputs: Unobservable inputs for the asset or liability used to measure fair value to the extent that observable inputs are not available, thereby allowing for situations in which there is little, if any, market activity for the asset or liability at measurement date. |
New Accounting Pronouncements
In February 2016, the FASB issued ASU No. 2016-02, Leases (“ASU 2016-02”), which is intended to improve financial reporting of leasing transactions. This standard requires a lessee to record on the balance sheet the assets and liabilities for the rights and obligations created by lease terms of more than 12 months. This standard will be effective for fiscal years beginning after December 15, 2018, including interim periods within those fiscal years, and early adoption is permitted. The company plans to implement the standard using the cumulative effect adjustment approach in the first quarter of 2019. The Company is currently finalizing the impact the adoption of ASU 2016-02 will have on its consolidated statements; however, the Company expects the adoption of this standard to result in a material increase in lease-related assets and liabilities on the consolidated balance sheets and an immaterial impact on the consolidated statements of income and cash flows.
2. Business Combinations
Cloverhill Acquisition
On February 1, 2018 (the “Purchase Date”), the Company acquired certain U.S. breakfast assets from Aryzta, LLC, including a bakery and the Cloverhill® and Big Texas® brand names (the “Cloverhill Business”). The Company acquired the Cloverhill Business to expand its breakfast product portfolio and to gain previously outsourced manufacturing capabilities for its existing product portfolio. The assets acquired and liabilities assumed constitute a business and were recorded at their fair values as of the Purchase Date under the acquisition method of accounting. Consideration for this acquisition included cash payments of $23.2 million.
HOSTESS BRANDS, INC.
NOTES TO CONSOLIDATED FINANCIAL STATEMENTS
Adjustments made during the fourth quarter of 2018 decreased the purchase price and net assets acquired by $0.8 million. As of December 31, 2018, the allocation of the purchase price is considered final. The following is a summary of the allocation of the purchase price:
|
| | | |
(In thousands) | |
Inventory | $ | 8,335 |
|
Other current assets | 500 |
|
Property and equipment | 13,272 |
|
Trade name and trademarks | 1,648 |
|
Customer relationships | 1,136 |
|
Other current liabilities | (1,731 | ) |
Net assets acquired | $ | 23,160 |
|
No goodwill was recognized as part of this acquisition.
The Company incurred $0.3 million of expenses related to this acquisition. These expenses are classified as business combination transaction costs on the consolidated statement of operations.
The operations of the acquired assets, which are included in the Company’s Sweet Baked Goods segment, provided net revenue of $74.2 million and negative gross profit of $25.0 million . The negative gross profit does not reflect the allocation of shared costs incurred by the Company. Due to the nature of these costs, the Company determined it was impracticable to allocate to individual bakeries.
Hostess Business Combination
As discussed in Note 1 - Summary of Significant Accounting Policies, on November 4, 2016 for accounting purposes Hostess Brands, Inc. was the acquirer of Hostess Holdings. During the 2016 Predecessor Period, approximately $31.3 million of expenses were incurred directly related to the Hostess Business Combination. From January 1, 2016 through the date of its last filing for the nine month period ending September 30, 2016, Gores Holdings incurred $4.0 million of transaction related expenses. From October 1, 2016 through the Closing Date, Gores Holdings incurred $6.7 million of expenses related to the Hostess Business Combination. On the Closing Date, the Company paid $13.1 million of deferred underwriting costs related to Gores Holdings’ initial public offering and repaid a working capital loan of $0.2 million.
The following unaudited pro forma combined financial information presents the Company’s results as though the Hostess Business Combination had occurred at January 1, 2016. The unaudited pro forma consolidated financial information has been prepared using the acquisition method of accounting in accordance with U.S. GAAP:
|
| | | | |
| | Year Ended December 31, 2016 |
(In thousands) | | (Pro Forma) (Unaudited) |
Net Revenue | | $ | 727,586 |
|
Net Income | | 82,442 |
|
HOSTESS BRANDS, INC.
NOTES TO CONSOLIDATED FINANCIAL STATEMENTS
Superior Acquisition
On May 10, 2016, the Predecessor purchased the stock of Superior for $51.1 million, $49.7 million net of cash acquired. Superior is located in Southbridge, Massachusetts and manufactures eclairs, madeleines, brownies, and iced cookies. The Predecessor acquired Superior to expand into the In-Store Bakery section of grocery and club retailers.
The 2016 Predecessor Period, the Company incurred acquisition‑related costs for Superior of approximately $0.6 million. For the 2016 Predecessor Period net revenue and net income for Superior was $19.9 million and $0.7 million, respectively. For the 2016 Successor Period, net revenue and net loss for Superior was $6.8 million, and $0.1 million, respectively. The acquisition of Superior was deemed not material to the Company under Item 3-05 of Regulation S-X, and, therefore, separate financial statements are not required because Superior does not meet the definition of a “significant subsidiary”.
3. Stock-Based Compensation
Hostess Brands, Inc. 2016 Equity Incentive Plan
The Hostess Brands, Inc. 2016 Equity Incentive Plan (the “2016 Plan”) provides for the granting of various equity-based incentive awards to members of the Board of Directors of the Company, Company employees and service providers to the Company. The types of equity-based awards that may be granted under the 2016 Plan include: stock options, stock appreciation rights (SARs), restricted stock, restricted stock units (RSUs), and other stock-based awards. There are 7,150,000 registered shares of Class A common stock reserved for issuance under the 2016 Plan. All awards issued under the 2016 Plan may only be settled in shares of Class A common stock. As of December 31, 2018, 4,748,036 shares remained available for issuance under the 2016 Plan.
Equity-based compensation expense totaled approximately $5.6 million and $7.4 million for the Successor years ended December 31, 2018 and December 31, 2017, respectively. There was no equity-based compensation expense for either the Successor or Predecessor periods in 2016 related to the 2016 Plan.
Restricted Stock Units (“RSUs”)
The fair value of RSU awards is calculated based on the closing market price of the Company’s Class A Common Stock on the date of grant. Compensation expense is recognized straight-line over the requisite service period of the awards, ranging from one to three years.
The vesting of certain RSU awards is contingent upon the Company attaining positive earnings per share for the fiscal year ending immediately prior to the vesting date. Management has determined it is probable that these performance conditions will be met.
For certain RSU awards, a portion of the granted units are banked at each annual performance period if the Company achieves certain EBITDA targets. Banked shares continue to be subject to the requisite service period under the terms of the awards. Depending on actual performance during each of the three annual performance periods, award recipients have the opportunity to receive up to 225% of the granted units. At December 31, 2018 and 2017 there were 349.2 thousand and 377.6 thousand RSU awards with EBITDA performance conditions outstanding, respectively.
The vesting of certain RSU awards is contingent upon the Company’s Class A stock achieving a certain total stockholder return (“TSR”) in relation to a group of its peers, measured over a two or three year period. Depending on the actual performance over the measurement period, an award recipient has the opportunity to receive up to 200% of the granted awards. At December 31, 2018 there were 66.4 thousand RSU awards with TSR performance conditions outstanding.
Upon an employee’s termination, all unvested awards will be forfeited and the shares of common stock underlying such award will become available for issuance under the 2016 Plan.
HOSTESS BRANDS, INC.
NOTES TO CONSOLIDATED FINANCIAL STATEMENTS
The following table summarizes the activity of the Company’s unvested RSUs: |
| | | | | | |
| Restricted Stock
Units | | Weighted Average
Grant Date
Fair Value |
Unvested units as of December 31, 2016 (Successor) | — |
| | $ | — |
|
Total Granted | 1,448,736 |
| | 15.73 |
|
Forfeited | (390,038 | ) | | 15.78 |
|
Vested(1) | (142,804 | ) | | 15.55 |
|
Unvested as of December 31, 2017 (Successor) | 915,894 |
| | $ | 15.73 |
|
Total Granted | 440,883 |
| | 12.92 |
|
Forfeited | (172,257 | ) | | 15.46 |
|
Vested(2) | (288,736 | ) | | 15.61 |
|
Unvested as of December 31, 2018 (Successor) | 895,784 |
| | $ | 14.46 |
|
(1)Includes 40,223 shares withheld to satisfy $0.4 million of employee tax obligations upon vesting.
(2)Includes 81,960 shares withheld to satisfy $1.0 million of employee tax obligations upon vesting.
As of December 31, 2018 and 2017, there was $6.4 million and $6.5 million of total unrecognized compensation cost, respectively, related to non-vested RSUs granted under the 2016 Plan that are considered probable to vest; that cost is expected to be recognized over a weighted average remaining period of approximately 1.5 and 2.0 years, respectively. As of December 31, 2018 and 2017, the grant date fair value of awards for which no compensation was recognized because it is not probable that the performance conditions will be met is $4.1 million and $4.8 million, respectively.
For the years ended December 31, 2018 and 2017, $4.3 million and $5.4 million of compensation expense related to the RSUs was recognized within general and administrative expenses on the consolidated statement of operations, respectively.
Restricted Stock Awards
During the year ended December 31, 2017, the Company granted 435,000 shares of restricted stock to the Company’s Chief Executive Officer under the 2016 Plan. The fair value of the RSAs was calculated based on the closing market price of the Company’s Class A common stock on the grant date. Also during 2017, with the announcement of the Company’s Chief Executive Officer’s retirement, the grant was reduced so 75,000 shares would vest on January 1, 2018.
As of December 31, 2017, there was no unrecognized compensation cost related to the non-vested restricted stock. For the year ended December 31, 2017, the Company recognized expense of $1.0 million related to the restricted stock awards within general and administrative expenses on the consolidated statement of operations. As of December 31, 2018 there were no outstanding RSA’s.
HOSTESS BRANDS, INC.
NOTES TO CONSOLIDATED FINANCIAL STATEMENTS
Stock Options
The following table includes the significant inputs used to determine the fair value of options issued under the 2016 plan.
|
| | |
| Year Ended December 31, 2018 | Year Ended December 31, 2017 |
Expected volatility (1) | 27.13% | 27.46% |
Expected dividend yield (2) | —% | —% |
Expected option term (3) | 6.25 years | 6.24 years |
Risk-free rate (4) | 2.98% | 2.09% |
| |
(1) | The expected volatility assumption was calculated based on a peer group analysis of stock price volatility with a look back period based on the expected term and ending on the grant date. |
| |
(2) | From its inception through December 31, 2018, the Company has not paid any dividends on its common stock. As of the stock option grant date, the Company does not anticipate paying any dividends on common stock over the term of the stock options. Option holders have no right to dividends prior to the exercise of the options. |
| |
(3) | The Company utilized the simplified method to determine the expected term of the stock options since the Company does not have sufficient historical exercise data to provide a reasonable basis upon which to estimate expected term. |
| |
(4) | The risk-free interest rate was based on the U.S. Treasury yield curve in effect at the time of grant which corresponds to the expected term of the stock options. |
The stock options vest in four equal annual installments on varying dates through 2022. The maximum term under the grant agreement is ten years. As of December 31, 2018, there was $2.2 million of total unrecognized compensation cost related to non-vested stock options outstanding under the 2016 Plan; that cost is expected to be recognized over the vesting periods. For the year ended December 31, 2018 and December 31, 2017, there was $1.3 million and $1.0 million of expense related to the stock options recognized within general and administrative costs on the consolidated statement of operations, respectively.
The following table summarizes the activity of the Company’s unvested stock options.
|
| | | | | | | | | | | | | |
| Number
of
Options | | Weighted Average
Remaining
Contractual Life
(years) | | Weighted
Average
Exercise Price | | Weighted
Average Grant
Date Fair Value |
Outstanding as of December 31, 2016 (Successor) | — |
| | — |
| | $ | — |
| | $ | — |
|
Granted | 1,202,613 |
| | 5.52 |
| | 15.75 |
| | 4.99 |
|
Exercised | — |
| | — |
| | — |
| | — |
|
Forfeited | (374,993 | ) | | 5.47 |
| | 15.78 |
| | 5.04 |
|
Outstanding as of December 31, 2017 (Successor) | 827,620 |
| | 5.54 |
| | $ | 15.74 |
| | $ | 4.97 |
|
Exercisable as of December 31, 2017 (Successor) | 241,931 |
| | 5.47 |
| | $15.78 | | $5.04 |
Granted | 382,070 |
| | 5.86 |
| | 13.46 |
| | 4.53 |
|
Exercised | — |
| | — |
| | — |
| | — |
|
Forfeited | (265,751 | ) | | 5.24 |
| | 14.7 |
| | 5.24 |
|
Outstanding as of December 31, 2018 (Successor) | 943,939 |
| | 5.45 |
| | $13.54 | | $4.97 |
Exercisable as of December 31, 2018 (Successor) | 273,759 |
| | 4.53 |
| | $15.47 | | $5.00 |
HOSTESS BRANDS, INC.
NOTES TO CONSOLIDATED FINANCIAL STATEMENTS
Hostess Management, LLC Equity Interest Plan (Predecessor)
The Company established a profits interest plan under the 2013 Hostess Management, LLC (“Hostess Management”) Equity Incentive Plan (“2013 Plan”) to allow members of the management team to participate in the success of the Company. The 2013 Plan consisted of an approximate 9% ownership interest in the Company’s subsidiary, New Hostess Holdco, LLC. Hostess Management had three classes of units and required certain returns to ranking classes before other classes participated in subsequent returns of Hostess Management.
The Company recognized unit-based compensation expense of $3.9 million for the 2016 Predecessor period, including $3.2 million of expense due to a grant agreement provision which caused the accelerated vesting of units granted prior to January 1, 2016 upon consummation of the Hostess Business Combination and the accelerated vesting of units granted in 2016 based on the approval of the board of directors. All outstanding units under the 2013 Plan were redeemed and the 2013 Plan was terminated on November 4, 2016.
Related Party Stock Awards
See Note 15 - Related Party Transactions for information regarding additional equity awards not issued under the 2016 or 2013 Plans.
4. Property and Equipment
Property and equipment consists of the following:
|
| | | | | | | |
(In thousands) | December 31,
2018 | | December 31, 2017 |
| | | |
Land and buildings | $ | 47,418 |
| | $ | 32,088 |
|
Machinery and equipment | 194,830 |
| | 141,995 |
|
Construction in progress | 6,059 |
| | 13,489 |
|
| 248,307 |
| | 187,572 |
|
Less accumulated depreciation | (27,958 | ) | | (13,451 | ) |
| $ | 220,349 |
| | $ | 174,121 |
|
Depreciation expense was $14.6 million and $11.8 million for the years ended December 31, 2018 and 2017, respectively. Depreciation expense was $1.6 million for the 2016 Successor Period and $7.6 million for the 2016 Predecessor Period.
5. Segment Reporting
The Company has two reportable segments: Sweet Baked Goods and In-Store Bakery. The Company’s Sweet Baked Goods segment consists of fresh and frozen baked goods and bread products that are sold under the Hostess®, Dolly Madison®, Cloverhill®, and Big Texas® brands. The In-Store Bakery segment consists primarily of Superior on Main® branded products sold through the in-store bakery section of grocery and club stores.
The Company evaluates performance and allocates resources based on net revenue and gross profit. Information regarding the operations of these reportable segments is as follows:
|
| | | | | | | | | | | | | | | | |
(In thousands) | Year Ended
December 31,
2018 | | Year Ended
December 31,
2017 | | From November 4
through
December 31,
2016 | | | From January 1
through
November 3, 2016 |
| (Successor) | | (Successor) | | (Successor) | | | (Predecessor) |
Net revenue: |
|
| |
|
| | | | |
|
|
Sweet Baked Goods | $ | 808,355 |
| | $ | 733,827 |
| | $ | 105,211 |
| | | $ | 595,645 |
|
In-Store Bakery | 42,034 |
| | 42,361 |
| | 6,787 |
| | | 19,943 |
|
Net revenue | $ | 850,389 |
| | $ | 776,188 |
| | $ | 111,998 |
| | | $ | 615,588 |
|
| | | | | | | | |
Depreciation and amortization (1): | | | | | | | | |
Sweet Baked Goods | $ | 38,607 |
| | $ | 35,441 |
| | $ | 5,245 |
| | | $ | 9,221 |
|
In-Store Bakery | 2,804 |
| | 2,729 |
| | 598 |
| | | 1,044 |
|
Depreciation and amortization | $ | 41,411 |
| | $ | 38,170 |
| | $ | 5,843 |
| | | $ | 10,265 |
|
| | | | | | | | |
Gross profit: | | | | | | | | |
Sweet Baked Goods | $ | 258,995 |
| | $ | 316,916 |
| | $ | 37,387 |
| | | $ | 260,876 |
|
In-Store Bakery | 8,282 |
| | 9,982 |
| | 1,327 |
| | | 5,653 |
|
Gross profit | $ | 267,277 |
| | $ | 326,898 |
| | $ | 38,714 |
| | | $ | 266,529 |
|
| | | | | | | | |
Capital expenditures (2): | | | | | | | | |
Sweet Baked Goods | $ | 53,394 |
| | $ | 35,609 |
| | $ | 7,544 |
| | | $ | 31,254 |
|
In-Store Bakery | 354 |
| | 774 |
| | 83 |
| | | 223 |
|
Capital expenditures | $ | 53,748 |
| | $ | 36,383 |
| | $ | 7,627 |
| | | $ | 31,477 |
|
| |
(1) | Depreciation and amortization include charges to net income classified as costs of goods sold and general and administrative expenses on the consolidated statement of operations. |
| |
(2) | Capital expenditures consists of purchases of property and equipment and acquisition and development of software assets paid in cash or acquired through accounts payable. |
Total assets by reportable segment are as follows:
|
| | | | | | | | |
(In thousands) | December 31,
2018 | | | December 31,
2017 |
| (Successor) | | | (Successor) |
Total segment assets: |
|
| | |
|
|
Sweet Baked Goods | $ | 2,924,333 |
| | | $ | 2,884,642 |
|
In-Store Bakery | 86,380 |
| | | 81,633 |
|
Total segment assets | $ | 3,010,713 |
| | | $ | 2,966,275 |
|
6. Goodwill and Intangible Assets
Goodwill and intangible assets as of December 31, 2018 and 2017 were recognized as part of the purchase price allocations of the Hostess Business Combination as well as the acquisition of the Cloverhill Business in 2018. During the year ended December 31, 2017, the purchase price allocation for the Hostess Business Combination was adjusted, resulting in a $9.0 million decrease to goodwill. As of December 31, 2018, the purchase price allocations for all prior acquisitions are considered final.
During the year ended December 31, 2018, the Company recognized impairment charges of $2.7 million and $0.6 million to the goodwill and trade names, respectively, in other operating expense within the In-Store Bakery reporting unit. These charges reflect the lower than expected performance of certain branded product lines as compared to expectations when the In-Store Bakery reporting unit was remeasured during the Hostess Business Combination.
Activity of goodwill is presented below by reportable segment:
|
| | | | | | | | | | | |
(In thousands) | Sweet Baked Goods | | In-Store Bakery | | Total |
Balance as of December 31, 2016 | $ | 542,410 |
| | $ | 46,050 |
| | $ | 588,460 |
|
Measurement period adjustments | (12,987 | ) | | 3,973 |
| | (9,014 | ) |
Balance as of December 31, 2017 | $ | 529,423 |
| | $ | 50,023 |
| | $ | 579,446 |
|
Impairment | — |
| | (2,700 | ) | | (2,700 | ) |
Other reclassifications and tax adjustments | 6,430 |
| | (7,531 | ) | | (1,101 | ) |
Balance as of December 31, 2018 | $ | 535,853 |
| | $ | 39,792 |
| | $ | 575,645 |
|
Intangible assets consist of the following:
|
| | | | | | | |
(In thousands) | December 31, 2018 | | December 31, 2017 |
Intangible assets with indefinite lives (Trademarks and Trade Names) | $ | 1,410,497 |
| | $ | 1,408,848 |
|
Intangible assets with definite lives (Customer Relationships) | 543,120 |
| | 542,011 |
|
Less accumulated amortization (Customer Relationships) | (51,802 | ) | | (27,771 | ) |
Less accumulated impairment charges (Trademarks and Trade Names) | (600 | ) | | — |
|
Intangible assets, net | $ | 1,901,215 |
| | $ | 1,923,088 |
|
Amortization expense was $24.1 million and $23.9 million for the years ended December 31, 2018 and 2017, respectively, $3.9 million for the 2016 Successor Period, and $1.2 million for the 2016 Predecessor Period. The unamortized portion of customer relationships will be expensed over their remaining useful life, from 18 to 23 years. The weighted-average amortization period as of December 31, 2018 for customer relationships was 20.7 years. Future expected amortization expense is as follows:
|
| | | |
(In thousands) | |
2019 | $ | 24,036 |
|
2020 | 24,036 |
|
2021 | 24,036 |
|
2022 | 24,036 |
|
2023 | 24,036 |
|
2024 and thereafter | 371,138 |
|
7. Accrued Expenses
Included in accrued expenses are the following
|
| | | | | | | | |
(In thousands) | December 31, 2018 |
|
| December 31, 2017 |
| (Successor) | | | (Successor) |
Incentive compensation | $ | 3,261 |
| | | $ | 4,259 |
|
Payroll, vacation and other compensation | 6,104 |
| | | 4,342 |
|
Self-insurance reserves | 1,646 |
| | | 1,192 |
|
Accrued interest | 4,849 |
| | | 338 |
|
Current income taxes payable | 411 |
| | | 99 |
|
Workers compensation reserve | 1,866 |
| | | 1,650 |
|
| $ | 18,137 |
| | | $ | 11,880 |
|
8. Tax Receivable Agreement
The tax receivable agreement was entered into by the Company in connection with the Hostess Business Combination (the “Tax Receivable Agreement”) and generally provides for the payment by the Company to the Legacy Hostess Equityholders of 85% of the net cash savings, if any, in U.S. federal, state and local income taxes that the Company realizes (or is deemed to realize in certain circumstances) in periods after the closing of the Hostess Business Combination (which periods may extend, unless the Tax Receivable Agreement is terminated early in accordance with its terms, for more than 15 years following any exchange of Class B Units of Hostess Holdings for shares of the Company’s Class A common stock or the cash equivalent thereof) as a result of (i) certain increases in tax basis resulting from the Hostess Business Combination; (ii) certain tax attributes of Hostess Holdings and its subsidiaries existing prior to the Hostess Business Combination and prior to subsequent exchanges of Class B Units; (iii) certain increases in tax basis resulting from exchanges of Class B Units; (iv) imputed interest deemed to be paid by the Company as a result of payments it makes under the Tax Receivable Agreement; and (v) certain increases in tax basis resulting from payments the Company makes under the Tax Receivable Agreement. The Company will retain the benefit of the remaining 15% of these cash savings. Certain payments under the Tax Receivable Agreement will be made to the Metropoulos Entities in accordance with specified percentages, regardless of the source of the applicable tax attribute. The Company recognizes a liability on the consolidated balance sheet based on the undiscounted estimated future payments under the Tax Receivable Agreement. Significant inputs used to estimate the future expected payments include a cash tax savings expressed as a rate of approximately 26.9%.
The following table summarizes activity related to the Tax Receivable Agreement:
|
| | | | |
(In thousands) | | |
Balance December 31, 2016 | | $ | 165,384 |
|
Measurement period adjustments | | (3,017 | ) |
Exchanges of Class B units for Class A shares | | 12,215 |
|
Remeasurement due to change in state tax rate | | 1,589 |
|
Remeasurement due to Tax Reform | | (51,811 | ) |
Balance December 31, 2017 (Successor) | | $ | 124,360 |
|
Exchange of Class B units for Class A shares | | 294 |
|
Reduction of future payments due to Buyout | | (46,372 | ) |
Remeasurement due to change in estimated state tax rate | | (1,866 | ) |
Payments | | (7,353 | ) |
Balance December 31, 2018 (Successor) | | $ | 69,063 |
|
As of January 26, 2018, the Company entered into an agreement to terminate all future payments payable under the Tax Receivable Agreement to the Apollo Funds in exchange for a payment of $34.0 million (the “Buyout”). Subsequent to the Buyout, the Company will retain a greater portion of the future cash tax savings subject to the Tax Receivable Agreement. The Buyout did not affect the portion of the rights under the Tax Receivable Agreement payable to the Metropoulos Entities, including those previously assigned by the Apollo Funds. During the year ended December 31, 2018, the Company also recognized a gain due to a change in the estimated state tax rate which decreased the Company’s estimated cash tax savings rate from approximately 27.5% to 26.9%.
During the year ended December 31, 2017, the Company remeasured the Tax Receivable Agreement due to changes in federal and state laws. The impact of the change in state tax rate was approximately $1.6 million of expense on the consolidated statement of operations. The Company also remeasured the Tax Receivable Agreement due to the Tax Reform which decreased the Company’s estimated cash tax savings rate from approximately 37.4% to 27.5%, primarily due to a permanent Federal tax rate reduction. This resulted in a $51.8 million benefit on the consolidated statement of operations which was reported as a component of operating income.
As of December 31, 2018 the future expected payments under the Tax Receivable Agreement are as follows:
|
| | | |
(In thousands) | |
2019 | $ | 4,400 |
|
2020 | 4,400 |
|
2021 | 4,000 |
|
2022 | 4,000 |
|
2023 | 4,000 |
|
Thereafter | 48,263 |
|
9. Debt
A term loan was originated on November 20, 2017 through the Company’s subsidiary, Hostess Brands, LLC (referred to below as the “Third Term Loan”). It requires quarterly payments of interest at a rate of the greater of the applicable LIBOR or 0.75% per annum (“New LIBOR Floor”) plus a margin of 2.25% per annum and principal at a rate of 0.25% of the aggregate principal balance with the remaining principal amount due upon maturity on August 3, 2022. The Third Term Loan is secured by substantially all of Hostess Brands, LLC’s present and future assets. The interest rate charged to the Company on the Third Term Loan from its origination through December 31, 2018 was 4.64%.
The Third Term Loan refinanced the remaining balance of $993.8 million on the Second New First Lien Term Loan (“Second Term Loan”) through a non-cash refinancing transaction. The Second Term Loan was originated by Hostess Brands, LLC on May 19, 2017 and required quarterly payments of interest at a rate equal to the the New Libor Floor plus a margin of 2.50% per annum and principal at a rate of 0.25% of the aggregate principal balance with the remaining principal amount due upon maturity on August 3, 2022. The Second Term Loan was secured by substantially all of Hostess Brands’ present and future assets. The interest rate charged to the Company on the Second Term Loan from its origination to refinancing was 3.67%.
The Second Term Loan refinanced the remaining balance of $996.3 million on the New First Lien Term Loan (“First Term Loan”) through a non-cash refinancing transaction. The First Term Loan was originated by Hostess Brands, LLC on November 18, 2016 and required quarterly payments of interest at a rate of the greater of the applicable LIBOR or 1% per annum (“LIBOR Floor”) plus a margin of 3.0% per annum and principal at a rate of 0.25% of the aggregate principal balance with the remaining principal amount due upon maturity on August 3, 2022. The First Term Loan was secured by substantially all of Hostess Brands’ present and future assets. The interest rate charged to the Company on the First Term Loan from January 1, 2017 through refinancing was 4.00%.
The First Term Loan refinanced the remaining balance on the First and Second Term Loans (referred to below as the Former First Term Loan and Former Second Term Loan, respectively) previously incurred by Hostess Brands, LLC of $915.7 million and $83.0 million, respectively, through a non-cash refinancing transaction in November 2016. The Company expensed prepayment penalties of $3.0 million as part of the deleverage and refinancing, in accordance with the contractual terms of Former First and Second Term loans.
Prior to its refinancing, required quarterly payments on the Former First Term Loan included interest at a rate of the greater of the LIBOR Floor plus an applicable margin of 3.50% per annum or the base rate plus an applicable margin of 2.25% or 2.50% per annum, based on the net leverage ratio, and principal at a rate of 0.25% of the aggregate principal amount through August 3, 2022, at which time all remaining principal was due.
In connection with the Hostess Business Combination, the Company recognized $8.9 million of premiums for the Former First and Second Term Loans. Lender debt discount costs, premium, and deferred financing costs are presented net of the long-term debt balance on the consolidated balance sheets and will be amortized to interest expense utilizing the effective interest method over the term of the debt. Portions of the lender debt discount costs, premium, and deferred financing costs have been adjusted through the recognition of gains or losses on the statement of operations along with a portion of other fees incurred with each of the aforementioned refinancing transactions.
A summary of the carrying value of the debt and the capital lease obligation is as follows:
|
| | | | | | | | |
(In thousands) | December 31, 2018 | | | December 31, 2017 |
| (Successor) | | | (Successor) |
Third Term Loan (4.6% as of December 31, 2018) | | | | |
Principal | $ | 983,825 |
| | | $ | 993,762 |
|
Unamortized debt premium and issuance costs | 3,778 |
| | | 4,857 |
|
| 987,603 |
| | | 998,619 |
|
Capital lease obligation (6.8% as of December 31, 2018) | 401 |
| | | 569 |
|
Total debt and capital lease obligation | 988,004 |
| | | 999,188 |
|
Less: Amounts due within one year | (11,268 | ) | | | (11,268 | ) |
Long-term portion | $ | 976,736 |
| | | $ | 987,920 |
|
At December 31, 2018 and 2017, the approximate fair value of the Company’s debt was $927.3 million and $998.7 million, respectively. The fair value is calculated using current interest rates and pricing from financial institutions (Level 2 inputs).
At December 31, 2018, minimum debt repayments under the Third Term Loan are due as follows:
|
| | | |
(In thousands) | |
2019 | $ | 9,938 |
|
2020 | 9,938 |
|
2021 | 9,938 |
|
2022 | 954,011 |
|
Revolving Credit Facility
Hostess Brands, LLC entered into a Revolving Credit Agreement (the “Revolver”) on August 3, 2015 that provides for borrowings up to $100.0 million. The Revolver has a stated maturity date of August 3, 2020 and is secured by liens on substantially all of Hostess Brands, LLC’s present and future assets, including accounts receivable and inventories, as defined in the Revolver. The Revolver is ranked equally with the Third Term Loan in regards to secured liens. The Revolver has an annual commitment fee on the unused portion of between 0.375% and 0.50% annually based upon the unused percentage. Interest on borrowings under the Revolver is, at Hostess Brands, LLC’s option, either the applicable LIBOR plus a margin of between 3.00% and 3.50% per annum or the base rate plus a margin of 2.00% to 2.50% per annum.
The Company had no outstanding borrowings under the Revolver as of December 31, 2018 or 2017. See Note 14 -- “Commitments and Contingencies” for information regarding the letters of credits, which reduce the amount available for borrowing under the Revolver. The Revolver contains certain restrictive financial covenants. As of December 31, 2018, the Company was in compliance with these covenants.
10. Interest Rate Swap
To reduce the effect of interest rate fluctuations, the Company entered into an interest rate swap contract with a counter party to make a series of payments based on a fixed interest rate of 1.78% and receive a series of payments based on the greater of LIBOR or 0.75%. Both the fixed and floating payment streams are based on a notional amount of $500 million at the inception of the contract and will be reduced by $100 million each year of the five-year contract. As of December 31, 2018, the notional amount is $400 million. The Company entered into this transaction to reduce its exposure to changes in cash flows associated with its variable rate debt and has designated this derivative as a cash flow hedge. At December 31, 2018, the effective fixed interest rate on the long-term debt hedged by this contract was 4.03%.
As of December 31, 2018, the fair value of the interest rate swap contract of $5.1 million was reported within other assets, net on the consolidated balance sheet. The $2.5 million of unrealized income recognized in accumulated other comprehensive income as of December 31, 2018 is expected to be reclassified into interest expense through December 31, 2019. The fair value of the interest rate swap contract is measured on a recurring basis by netting the discounted future fixed cash payments and the discounted expected variable cash receipts. The variable cash receipts are based on the expectation of future interest rates (forward curves) derived from observed market interest rate curves (Level 2).
11. Equity
The Company’s authorized common stock consists of three classes: 200,000,000 shares of Class A common stock, 50,000,000 shares of Class B common stock, and 10,000,000 shares of Class F common stock (none of which were issued and outstanding at December 31, 2018 or 2017). As of December 31, 2018 and 2017, there were 100,046,392 and 99,791,245 shares of Class A common stock issued and outstanding, respectively. At December 31, 2018 and 2017 there were 30,255,184 and 30,319,564 shares of Class B common stock issued and outstanding, respectively.
Shares of Class A common stock and Class B common stock have identical voting rights. However, shares of Class B common stock do not participate in earnings or dividends of the Company. Ownership of shares of Class B common stock is restricted to owners of Class B units in Hostess Holdings. Class B units in Hostess Holdings may be exchanged (together with the cancellation of an equivalent number of shares of Class B common stock) by the holders thereof for, at the election of the Company, shares of Class A common stock or the cash equivalent of such shares.
As of December 31, 2018 and 2017, there were 48,274,307 and 44,182,889 public warrants, and 8,225,583 and 12,317,001 private placement warrants outstanding, respectively. Each warrant entitles its holder to purchase one-half of one share of Class A common stock at an exercise price of $5.75 per half share, to be exercised only for a whole number of shares of Class A common stock. The warrants expire on December 4, 2021, or earlier upon redemption or liquidation. The Company may call the outstanding public warrants for redemption at a price of $0.01 per warrant, if the last sale price of the Company’s common stock equals or exceeds $24.00 per share for any 20 trading days within a 30-trading day period ending on the third business day before the Company sends the notice of redemption to the warrant holders. The private placement warrants, however, are nonredeemable so long as they are held by the Company’s Sponsor or its permitted transferees. The private placement warrants have been registered with the SEC for future potential sales to the public. When sold to the public, the private placement warrants will become public warrants.
12. Earnings Per Share
Basic earnings per share is calculated by dividing net income attributable to the Company’s Class A stockholders for the period by the weighted average number of Class A common shares outstanding for the period excluding non-vested restricted stock awards. In computing dilutive earnings per share, basic earnings per share is adjusted for the assumed issuance of all applicable potentially dilutive share-based awards, including: public and private placement warrants, RSUs, restricted stock awards, and stock options.
Below are basic and diluted earnings (loss) per share:
|
| | | | | | | | | | | | |
| | Year Ended
December 31,
2018 | | Year Ended
December 31,
2017 | | From November 4, 2016 through December 31, 2016 |
| | (Successor) | | (Successor) | | (Successor) |
Numerator: | |
| |
| | |
Net income (loss) attributable to Class A stockholders (in thousands) | | $ | 62,895 |
| | $ | 223,897 |
| | $ | (4,404 | ) |
Denominator: | |
| |
| | |
Weighted-average Class A shares outstanding - basic (excluding non-vested restricted stock awards) | | 99,957,049 |
| | 99,109,629 |
| | 97,791,658 |
|
Dilutive effect of warrants | | 3,021,239 |
| | 6,113,053 |
| | — |
|
Dilutive effect of RSAs and RSUs | | 120,106 |
| | 84,611 |
| | — |
|
Weighted-average shares outstanding - diluted | | 103,098,394 |
| | 105,307,293 |
| | 97,791,658 |
|
Earnings (loss) per Class A share - basic | | $ | 0.63 |
| | $ | 2.26 |
| | $ | (0.05 | ) |
Earnings (loss) per Class A share - dilutive | | $ | 0.61 |
| | $ | 2.13 |
| | $ | (0.05 | ) |
For all years presented, the dilutive effect of stock options were excluded from the computation of diluted net income per share because the assumed proceeds from the awards’ exercise were greater than the average market price of the common shares.
13. Income Taxes
The Company accounts for income taxes under the asset and liability method. Under this method, deferred tax liabilities and assets are determined based on the difference between the financial statement and tax basis of assets and liabilities using enacted tax rates in effect for the year in which the difference is expected to reverse. Additionally, the impact of changes in the enacted tax rates and laws on deferred taxes, if any, is reflected in the financial statements in the period of enactment.
The income tax expense (benefit) consisted of the following:
|
| | | | | | | | | | | | | | | | |
(In thousands) | Year Ended December 31, 2018 | | Year Ended December 31, 2017 | | November 4, 2016
through December 31, 2016 | | | January 1, 2016
through November 3, 2016 |
| (Successor) | | (Successor) | | (Successor) | | | (Predecessor) |
Current tax expense (benefit) | | | | | | | | |
Federal | $ | 622 |
| | $ | 11,163 |
| | $ | 10 |
| | | $ | 35 |
|
State and local | 2,077 |
| | 2,903 |
| | 43 |
| | | 12 |
|
Total Current | 2,699 |
| | 14,066 |
| | 53 |
| | | 47 |
|
| | | | | | | | |
Deferred tax expense (benefit) | | | | | | | | |
Federal | 14,476 |
| | (93,457 | ) | | $ | (6,752 | ) | | | 343 |
|
State and local | (4,221 | ) | | 12,187 |
| | (1,063 | ) | | | 49 |
|
Total Deferred | 10,255 |
| | (81,270 | ) | | (7,815 | ) | | | 392 |
|
Income tax expense (benefit), net | $ | 12,954 |
| | $ | (67,204 | ) | | $ | (7,762 | ) | | | $ | 439 |
|
As a result of the Hostess Business Combination, the Company acquired a controlling interest in Hostess Holdings, which is treated as a partnership for U.S. federal and most applicable state and local income tax purposes. As a partnership, Hostess Holdings is not itself subject to U.S. federal and certain state and local income taxes. Any taxable income or loss generated by Hostess Holdings is passed through and included in the taxable income or loss of its partners, including the Company in Successor periods. The Company is subject to U.S. federal income taxes, in addition to state and local income taxes with respect to its allocable share of any taxable income of Hostess Holdings following the Hostess Business Combination.
The operations of Hostess Holdings include those of its C corporation subsidiaries. These C corporation subsidiaries are subject to U.S. federal, state and local income taxes. The Company’s tax provision includes income taxes for the share of Hostess Holdings income or loss passed through to the Company, the income or loss of the Company’s C corporation subsidiaries and the deferred tax tax impact of outside basis differences in its investments in subsidiaries.
For the year ended December 31, 2018 and 2017, as well as the 2016 Successor Periods and 2016 Predecessor Period, the effective income tax rate differs from the federal statutory income tax rate as explained below:
|
| | | | | | | | | | | | |
| Year Ended December 31, 2018 | | Year Ended December 31, 2017 | | November 4, 2016
through December 31, 2016 | | | January 1, 2016
through November 3, 2016 |
| (Successor) | | (Successor) | | (Successor) | | | (Predecessor) |
U. S. federal statutory income tax rate | 21.0 | % | | 35.0 | % | | 35.0 | % | | | 35.0 | % |
| | | | | | | | |
State and local income taxes, net of federal benefit | 4.3 |
| | 3.8 |
| | 4.1 |
| | | 0.1 |
|
Income attributable to non-controlling interest | (4.1 | ) | | (6.3 | ) | | (8.8 | ) | | | — |
|
Nontaxable partnerships | — |
| | — |
| | — |
| | | (34.4 | ) |
Valuation allowance | — |
| | — |
| | 17.2 |
| | | — |
|
Tax Cuts and Jobs Act | — |
| | (66.2 | ) | | — |
| | | — |
|
Change in state tax rate | (6.0 | ) | | 1.2 |
| | — |
| | | — |
|
Gain on TRA buyout | (1.4 | ) | | — |
| | — |
| | | — |
|
Other | (0.1 | ) | | (2.7 | ) | | 0.3 |
| | | — |
|
Effective income tax rate | 13.7 | % | | (35.2 | )% | | 47.8 | % | | | 0.7 | % |
Deferred income taxes are provided for the effects of temporary differences between the tax basis of an asset or liability and its reported amount in the accompanying consolidated balance sheets. These temporary differences result in taxable or deductible amounts in future years. Details of the Company’s deferred tax assets and liabilities are summarized as follows: |
| | | | | | | |
(In thousands) | As of December 31, 2018 | | As of December 31, 2017 |
| (Successor) | | (Successor) |
Deferred tax assets | | | |
Imputed interest | $ | 3,064 |
| | $ | 4,967 |
|
Tax credits | 2,696 |
| | 2,337 |
|
Disallowed interest carryforward | 2,374 |
| | — |
|
Net operating loss carryforwards | 1,000 |
| | 578 |
|
Other | 1,252 |
| | 1,002 |
|
Total deferred tax assets | 10,386 |
| | 8,884 |
|
Valuation allowance | — |
| | (242 | ) |
Total deferred tax assets, net of valuation allowance | 10,386 |
| | 8,642 |
|
| | | |
Deferred tax liabilities | | | |
Investment in partnership | (279,015 | ) | | (266,900 | ) |
Goodwill and intangible assets | (7,023 | ) | | (7,512 | ) |
Property and equipment | (1,261 | ) | | (1,394 | ) |
Other | (1,041 | ) | | (607 | ) |
Total deferred tax liabilities | (288,340 | ) | | (276,413 | ) |
| | | |
Total deferred tax assets and liabilities | $ | (277,954 | ) | | $ | (267,771 | ) |
The recognition of deferred tax assets is based on management’s belief that it is more likely than not that the tax benefits associated with temporary differences, net operating loss carryforwards and tax credits will be utilized. The Company assesses the recoverability of the deferred tax assets on an ongoing basis. In making this assessment, the Company considers all positive and negative evidence, and all potential sources of taxable income including scheduled reversals of deferred tax liabilities, tax-planning strategies, projected future taxable income and recent financial performance.
Prior to the acquisition of Hostess Holdings, the Company did not have a significant source of taxable income to support the realization of its deferred tax assets and therefore had a full valuation allowance booked on its deferred tax assets. The Company re-evaluated its conclusion on November 4, 2016 due to the acquisition of Hostess Holdings and concluded that the valuation allowance was no longer appropriate.
The Company reversed $2.8 million of valuation allowance in the Successor Period of 2016. This reversal is reflected as a non-cash income tax benefit recorded in the accompanying consolidated statement of operations.
The Company and its C corporation subsidiaries file income tax returns in the U.S. federal jurisdiction and various state and local jurisdictions. For federal and state tax purposes, the Company and its C corporation subsidiaries are gernerally subject to examination for three years after the income tax returns are filed. As such, income tax returns filed since 2015 remain open for examination by tax authorities. The Company’s C corporation subsidiaries utilized U.S. loss carryforwards which date back to 2005, therefore those carryforwards are subject to examination as well. The Company and its C corporation subsidiaries are under IRS examination for the 2016 and 2017 tax years, respectively.
At December 31, 2018, the Company has an available federal net operating loss carryforward of approximately $3.3 million which carries forward indefinitely. The Company has U.S. state net operating losses of approximately $4.6 million and state credits of approximately $3.4 million. Unless utilized, the state net operating losses carryforwards expire from 2028 to 2038 and the state credits expire from 2028 to 2034.
The Company does not have any significant uncertain tax positions and therefore has no unrecognized tax benefits at either December 31, 2018 or 2017 that if recognized, would affect the annual effective tax rate. Therefore,the Company has not recorded any penalties and interest during the years ended December 31, 2018 or 2017. Interest and penalties related to income tax liabilities, if incurred, are included in income tax expense in the consolidated statement of operations.
Tax Reform significantly changes U.S. tax law by lowering the corporate income tax rate permanently from a maximum of 35% to a flat 21% rate, effective January 1, 2018. As a result of the reduction in the U.S. corporate income tax rate from 35% to 21% under Tax Reform, the Company revalued its ending net deferred tax liabilities at December 31, 2017 and recognized a non-cash tax benefit of $111.3 million in the Company’s consolidated statement of operating income for the year ended December 31, 2017.
14. Commitments and Contingencies
Accruals and the Potential Effect of Litigation
From time to time, the Company is subject to various legal actions, lawsuits, claims and proceedings related to products, employment, environmental regulations, and other matters incidental to its businesses. Based upon information presently known, the Company does not believe that the ultimate resolution of such matters will have a material effect on the Company’s financial position, although the final resolution of such matters could have a material effect on its results of operations or cash flows in the period of resolution.
Liabilities related to legal proceedings are recorded when it is probable that a liability has been incurred and the associated amount can be reasonably estimated. Where the estimated amount of loss is within a range of amounts and no amount within the range is a better estimate than any other amount, the low end of the range is accrued. As additional information becomes available, the potential liabilities related to these matters are reassessed and the estimates revised, if necessary. These accrued liabilities are subject to change in the future based on new developments in each matter, or changes in circumstances, which could have a material effect on the Company’s financial condition and results of operations.
Lease Commitments
Operating Leases
The Company leases facilities for its headquarters, one manufacturing site, and primary distribution center, under noncancelable operating lease arrangements. As of December 31, 2018, the Company’s total future minimum lease payments under these operating leases were $0.8 million payable in 2019.
Rent expense under all operating leases was $1.9 million and $2.0 million for the years ended December 31, 2018 and 2017, respectively, and $0.3 million for the 2016 Successor Period and $1.3 million for the 2016 Predecessor Period.
Capital Leases
The Company entered into a bond-lease agreement with the Development Authority of Columbus, Georgia on December 1, 2013, which was amended in December, 2016. The bond-lease transaction required the Company to exchange its
property to the taxing jurisdiction for tax-exempt bonds issued in the name of the Company not to exceed $18 million. As the issuer and holder of the bonds, the Company is not required to make lease payments. On December 16, 2013, the Company received an ad valorem tax agreement from the Columbus, Georgia Board of Tax Assessors granting tax abatement for the real and personal property located at the Company’s Columbus, Georgia bakery through 2023. The Company has elected to use the right of setoff under Accounting Standards Codification 210-20 to net the asset and the liability.
The Company has a capital lease obligation of $0.4 million for the lease located on its Southbridge, Massachusetts bakery facility. The base term of the lease is through February 2021.
Future minimum lease payments under capital leases were as follows:
|
| | | |
(In thousands) | |
2019 | $ | 200 |
|
2020 | 200 |
|
2021 | 33 |
|
Contractual Commitments
The Company is a party to various long-term arrangements through advance purchase contracts to lock in prices for certain high-volume raw materials and packaging components for normal product production requirements. These advance purchase arrangements are contractual agreements and can only be canceled with a termination penalty that is based upon the current market price of the commodity at the time of cancellation. These agreements qualify for the “normal purchase” exception under accounting standards; and the purchases under these contracts are included as a component of cost of goods sold.
Contractual commitments were as follows:
|
| | | | | | | | | |
(In millions) | Total Committed | Commitments within 1 year | Commitments beyond 1 year |
Ingredients | $ | 76.2 |
| $ | 76.2 |
| $ | — |
|
Packaging | 17.2 |
| 17.2 |
| — |
|
Letters of Credit
The Company is a party to Letter of Credit arrangements to provide for the issuance of standby letters of credit in the amount of $3.0 million and $2.2 million for the years ended 2018 and 2017, respectively. The arrangements support the collateral requirements for insurance. The Letters of Credit are 100% secured through our Revolver.
15. Related Party Transactions
Prior to the Hostess Business Combination, the Company was party to an agreement to employ Mr. Metropoulos as the Executive Chairman. The agreement, dated April 2013, included payment of an annual salary, a performance bonus at the discretion of the board of directors, and expenses related to the use of his personal aircraft. From January 1, 2016 through November 3, 2016, $3.5 million was expensed by the Company for this compensation agreement. For the year ended December 31, 2015, the Company expensed $4.3 million. The agreement with Mr. Metropoulos was terminated in connection with the Hostess Business Combination.
In connection with the Hostess Business Combination, the Company entered into an Executive Chairman Employment Agreement with Mr. Metropoulos. Under the terms of this agreement, on November 4, 2016, Mr. Metropoulos was granted 2,496,000 fully vested Class B Units of Hostess Holdings and an equivalent number of shares of Class B common stock in the Company as compensation for his continuing service as Executive Chairman.
The Company determined the fair value of this compensation as follows:
|
| | | | |
(In thousands, except share data) | | |
Number of Class B Units granted | | 2,496 |
|
Closing price of equivalent shares of Class A common stock on date of grant | | $ | 11.40 |
|
| | $ | 28,454 |
|
Discount for lack of marketability | | 6 | % |
| | $ | 26,747 |
|
As these units are subject to certain sales restrictions, a discount for lack of marketability was determined by using an option pricing method (Finnerty Protective Put Model). The $26.7 million of compensation expense related to these awards is recognized as related party expenses on the consolidated statements of operations in the 2016 Successor Period along with less than $0.1 million of other payments under this employment agreement.
Also in connection with the Hostess Business Combination and under the terms of Mr. Metropoulos’ employment agreement, the Company was obligated to grant additional equity to Mr. Metropoulos if certain EBITDA thresholds were met for 2017 and 2018. These thresholds were not met and no additional equity was granted to Mr. Metropoulos under these arrangements. The agreements expired by their terms on December 31, 2018.
16. Unaudited Quarterly Financial Data
Summarized quarterly financial data:
|
| | | | | | | | | | | | | | | | |
(In thousands) | | Three Months Ended December 31, 2018 | | Three Months Ended September 30, 2018 | | Three Months Ended June 30, 2018 | | Three Months Ended March 31, 2018 |
| | (Successor) | | (Successor) | | (Successor) | | (Successor) |
Net revenue | | $ | 214,815 |
| | $ | 210,982 |
| | $ | 215,849 |
| | $ | 208,743 |
|
Operating income | | 30,344 |
| | 23,693 |
| | 34,649 |
| | 32,872 |
|
Net income | | 16,352 |
| | 11,152 |
| | 24,620 |
| | 29,302 |
|
Net income (loss) attributable to Class A stockholders/partners | | $ | 11,830 |
| | $ | 7,941 |
| | $ | 19,283 |
| | $ | 23,841 |
|
Earnings (loss) per Class A share: | | | |
| |
| | |
Basic | | $ | 0.12 |
| | $ | 0.08 |
| | $ | 0.19 |
| | $ | 0.24 |
|
Diluted | | $ | 0.12 |
| | $ | 0.08 |
| | $ | 0.18 |
| | $ | 0.23 |
|
|
| | | | | | | | | | | | | | | | |
(In thousands) | | Three Months Ended December 31, 2017 | | Three Months Ended September 30, 2017 | | Three Months Ended June 30, 2017 | | Three Months Ended March 31, 2017 |
| | (Successor) | | (Successor) | | (Successor) | | (Successor) |
Net revenue | | $ | 196,221 |
| | $ | 192,250 |
| | $ | 203,178 |
| | $ | 184,538 |
|
Operating income | | 100,762 |
| | 38,716 |
| | 49,792 |
| | 44,723 |
|
Net income (loss) | | 189,574 |
| | 16,130 |
| | 28,207 |
| | 24,199 |
|
Net Income (loss) attributable to Class A stockholders/partners | | 179,686 |
| | 9,549 |
| | 18,830 |
| | 15,832 |
|
Earnings (loss) per Class A share: | | | | | | | | |
Basic | | $ | 1.80 |
| | $ | 0.10 |
| | $ | 0.19 |
| | $ | 0.16 |
|
Diluted | | $ | 1.74 |
| | $ | 0.09 |
| | $ | 0.18 |
| | $ | 0.15 |
|
As a result of Tax Reform, the Company remeasured its net deferred tax liabilities and recognized a $111.3 million non-cash tax benefit and also recognized a gain on the remeasurement of the Tax Receivable Agreement of $51.8 million during the three months ended December 31, 2017.
Item 9. Changes in and Disagreements with Accountants on Accounting and Financial Disclosure
None.
| |
Item 9A. | Controls and Procedures |
(a) Evaluation Of Disclosure Controls And Procedures
We have established disclosure controls and procedures (as defined in Rules 13a-15(e) and 15d-15(e)) of the Securities Exchange Act of 1934, as amended (the “Exchange Act”), that are designed to provide reasonable assurance that information required to be disclosed in our reports filed or submitted under the Exchange Act is recorded, processed, summarized and reported within the time periods specified in the rules and forms of the Securities and Exchange Commission, and that information relating to the Company is accumulated and communicated to management, including our Chief Executive Officer and Chief Financial Officer, as appropriate, to allow timely decisions regarding required disclosure. Based on that evaluation, the Chief Executive Officer and Chief Financial Officer have concluded that our current disclosure controls and procedures are effective at a level of reasonable assurance.
(b) Management’s Report On Internal Control Over Financial Reporting
Our management is responsible for establishing and maintaining adequate internal control over financial reporting, as defined in Exchange Act Rule 13a-15(f). Under the supervision and with the participation of our management, including our Chief Executive Officer and Chief Financial Officer, we conducted an evaluation of the effectiveness of our internal control over financial reporting based on criteria established in Internal Control - Integrated Framework (2013) by the Committee of Sponsoring Organization of the Treadway Commission. Based on that evaluation, our management concluded that our internal control over financial reporting was effective as of December 31, 2018. The effectiveness of the Company’s internal control of financial reporting as of December 31, 2018 has been audited by KPMG LLP, an independent registered public accounting firm, as stated in their report which appears herein.
(c) Changes in Internal Control over Financial Reporting
There have been no changes in our internal control over financial reporting during the most recent calendar quarter that has materially affected, or is reasonably likely to materially affect, our internal control over financial reporting. Following the completion of our acquisition of the Cloverhill Business on February 1, 2018, we implemented changes to our internal control over financial reporting that included the consolidation of the Cloverhill Business, as well as
acquisition-related accounting and disclosures. Changes arising from our acquisition of the Cloverhill Business represented a material change in internal control over financial reporting since management’s last assessment, which was completed as of December 31, 2017.
Item 9B. Other Information
None.
Item 10. Directors, Executive Officers and Corporate Governance
The information required by this item will be contained in our definitive proxy statement to be filed with the SEC in connection with our 2019 Annual Meeting of Stockholders, which is expected to be filed not later than 120 days after the end of our fiscal year, and is incorporated herein by reference.
Item 11. Executive Compensation
The information required by this item will be contained in our definitive proxy statement to be filed with the SEC in connection with our 2019 Annual Meeting of Stockholders, which is expected to be filed not later than 120 days after the end of our fiscal year, and is incorporated herein by reference.
Item 12. Security Ownership of Certain Beneficial Owners and Management and Related Stockholder Matters
The information required by this item will be contained in our definitive proxy statement to be filed with the SEC in connection with our 2019 Annual Meeting of Stockholders, which is expected to be filed not later than 120 days after the end of our fiscal year, and is incorporated herein by reference.
Item 13. Certain Relationships and Related Transactions, and Director Independence
The information required by this item will be contained in our definitive proxy statement to be filed with the SEC in connection with our 2019 Annual Meeting of Stockholders, which is expected to be filed not later than 120 days after the end of our fiscal year, and is incorporated herein by reference.
Item 14. Principal Accounting Fees and Services
The information required by this item will be contained in our definitive proxy statement to be filed with the SEC in connection with our 2019 Annual Meeting of Stockholders, which is expected to be filed not later than 120 days after the end of our fiscal year, and is incorporated herein by reference.
Part IV.
Item 15. Exhibits, Financial Statement Schedules
Financial Statements and Financial Statement Schedules
See “Index to consolidated financial statements” in Part II, Item 8 of this Annual Report on Form 10-K. Financial statement schedules have been omitted because they are not required or are not applicable or because the information required in those schedules either is not material or is included in the consolidated financial statements or the accompanying notes.
Item 6. Exhibits
|
| | | | |
Exhibit No. | | Description | | |
2.1* | | Master Transaction Agreement, dated as of July 5, 2016, by and among Gores Holdings, Inc., Homer Merger Sub, Inc., AP Hostess Holdings, L.P., Hostess CDM Co-Invest, LLC, CDM Hostess Class C, LLC, and AP Hostess Holdings, L.P., in its capacity as the Sellers’ Representative (1) | | |
3.1 | | | | |
3.2 | | | | |
4.1 | | | | |
4.2 | | | | |
4.3 | | | | |
10.1 | | | | |
10.2 | | | | |
10.3 | | Exchange Agreement, dated as of November 4, 2016 by and among Gores Holdings, Inc., Hostess Holdings, L.P., Hostess CDM Co-Invest, LLC, CDM Hostess Class C, LLC , C. Dean Metropoulos, and such other holders of Class B Units from time to time party thereto (2) | | |
10.4 | | Tax Receivable Agreement, dated November 4, 2016, by and among Gores Holdings, Inc., Hostess CDM Co-Invest, LLC, CDM Hostess Class C, LLC, AP Hostess Holdings, L.P., and C. Dean Metropoulos (2) | | |
10.5 | | Buyout and Amendment Agreement, dated as of January 26, 2018, by and among Hostess Brands, Inc., Hostess CDM Co-Invest, LLC, CDM Hostess Class C, LLC, CDM HB Holdings, LLC, AP Hostess Holdings, L.P., and C. Dean Metropoulos (6) | | |
10.6 | | Amended and Restated Registration Rights and Lock-Up Agreement, dated as of November 4, 2016, by and among Hostess Brands, Inc., AP Hostess Holdings, L.P., Hostess CDM Co-Invest, LLC, CDM Hostess Class C, LLC, C. Dean Metropoulos, Gores Sponsor LLC, Randy Bort, William Patton and Jeffrey Rea (2) | | |
10.7 | | | | |
10.8 | | | | |
10.9 | | | | |
10.11 | | | | |
10.12 | | | | |
10.13 | | | | |
10.14 | | | | |
10.14.1 | |
| | |
10.15 | | | | |
|
| | | | |
10.16 | | | | |
10.17 | | | | |
10.18 | | | | |
21.1 | | | | |
23.1 | | | | |
31.1 | | | | |
31.2 | | | | |
32.1 | | | | |
32.2 | | | | |
101.INS | | XBRL Instance Document | | |
101.SCH | | XBRL Taxonomy Extension Schema Document | | |
101.CAL | | XBRL Taxonomy Extension Calculation Linkbase Document | | |
101.DEF | | XBRL Taxonomy Extension Definition Linkbase Document | | |
101.LAB | | XBRL Taxonomy Extension Label Linkbase Document | | |
101.PRE | | XBRL Taxonomy Extension Presentation Linkbase Document | | |
*Schedules and exhibits to this Exhibit omitted pursuant to Regulation S-K Item 601(b)(2). The Company agrees to furnish supplementally a copy of any omitted schedules or exhibits to the SEC upon request.
| |
(1) | Filed as an exhibit to the Company’s Current Report on Form 8-K filed with the SEC on July 5, 2016 and incorporated herein by reference. |
| |
(2) | Filed as an exhibit to the Company’s Current Report on Form 8-K filed with the SEC on November 9, 2016 and incorporated herein by reference. |
| |
(3) | Filed as an exhibit to the Company’s Current Report on Form 8-K filed with the SEC on January 3, 2019 and incorporated herein by reference. |
| |
(4) | Filed as an exhibit of the Company’s Current Report on Form 8-K filed with the SEC on August 19, 2015 and incorporated herein by reference. |
| |
(5) | Filed as an exhibit to the Company’s Current Report on Form 8-K filed with the SEC on August 15, 2016 and incorporated herein by reference. |
| |
(6) | Filed as an exhibit to the Company’s Current Report on Form 8-K filed with the SEC on January 29, 2018 and incorporated herein by reference. |
| |
(7) | Filed as an exhibit to the Company’s Current Report on Form 8-K filed with the SEC on November 20, 2017 and incorporated herein by reference. |
| |
(8) | Filed as an exhibit to the Company’s Annual Report on Form 10-K for the year ended December 31, 2017 filed with the SEC on February 28, 2018 and incorporated herein by reference. |
| |
(9) | Filed as an exhibit to the Company’s Current Report on Form 8-K filed with the SEC on April 13, 2018 and incorporated herein by reference. |
| |
(10) | Filed as an exhibit to the Company’s Quarterly Report on Form 10-Q for the quarter ended March 31, 2018 filed with the SEC on May 9, 2018 and incorporated herein by reference. |
| |
(11) | Filed as an exhibit to the Company’s Current Report on Form 8-K filed with the SEC on August 6, 2018 and incorporated herein by reference. |
| |
(12) | Filed as an exhibit to the Company’s Quarterly Report on Form 10-Q for the quarter ended June 30, 2018 filed with the SEC on August 7, 2018 and incorporated herein by reference. |
| |
(13) | Filed as an exhibit to the Company’s Quarterly Report on Form 10-Q for the quarter ended September 30, 2018 filed with the SEC on November 7, 2018 and incorporated herein by reference. |
Pursuant to the requirements of Section 13 or 15(d) of the Securities Exchange Act of 1934, the registrant has duly caused this report to be signed on its behalf by the undersigned, thereunto duly authorized, in Kansas City, Missouri on February 27, 2019.
|
| |
HOSTESS BRANDS, INC. |
| |
By | /s/ Thomas A. Peterson |
| Thomas A. Peterson Executive Vice President, Chief Financial Officer |
Pursuant to the requirements of the Securities Exchange Act of 1934, this report has been signed by the following persons in the capacities and on the date indicated.
|
| | | | |
Signature | | Title | | Date |
| | | |
/s/ Andrew P. Callahan | | President, Chief Executive Officer (principal executive officer) and Director | | February 27, 2019 |
Andrew P. Callahan | | | |
/s/ Thomas A. Peterson | | Executive Vice President, Chief Financial Officer (principal financial officer and principal accounting officer) | | February 27, 2019 |
Thomas A. Peterson | | | |
/s/ C. Dean Metropoulos | | Chairman and Director | | February 27, 2019 |
C. Dean Metropoulos | | | |
/s/ Craig D. Steeneck | | Lead Independent Director | | February 27, 2019 |
Craig D. Steeneck | | | | |
/s/ Laurence Bodner | | Director | | February 27, 2019 |
Laurence Bodner | | | |
/s/ Gretchen R. Crist | | Director | | February 27, 2019 |
Gretchen R. Crist | | | | |
/s/ Neil P. DeFeo | | Director | | February 27, 2019 |
Neil P. DeFeo | | | |
/s/ Jerry D. Kaminski | | Director | | February 27, 2019 |
Jerry D. Kaminski | | | |